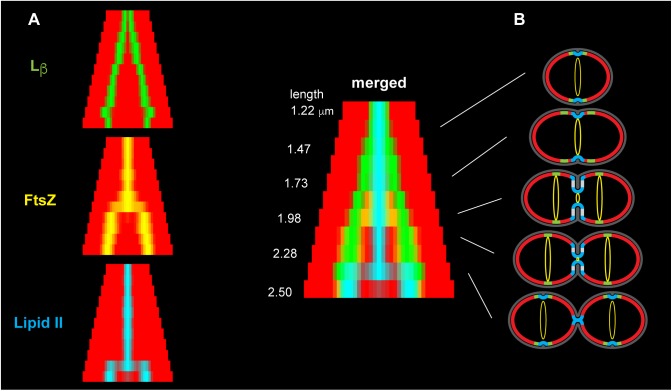
Figure 5.
Organization of lipid domains during the cell cycle of S. pneumoniae. (A) To compare different labeling experiments, cells were grouped in size classes and the fluorescence signals were averaged for each class and symmetrized. The panels show the regions of maximum signal for Lβ-phase (NBD-PG) (green), fluorescent FtsZ (yellow) and lipid II-NBD (cyan), on a background representing the Lα-phase (red). (B) Model of the membrane during the cell cycle of S. pneumoniae with the corresponding experimental fluorescence patterns. The cell-wall is in dark gray, the Z-ring is in yellow. Lβ-phase lipids are localized at the equator where the curvature is minimal (green). Lα-phase bilayer forms the hemispheres where the curvature is larger (red). The cell-wall precursor lipid II is localized at the sites of maximal curvature (cyan) where cell-wall synthesis takes place.

