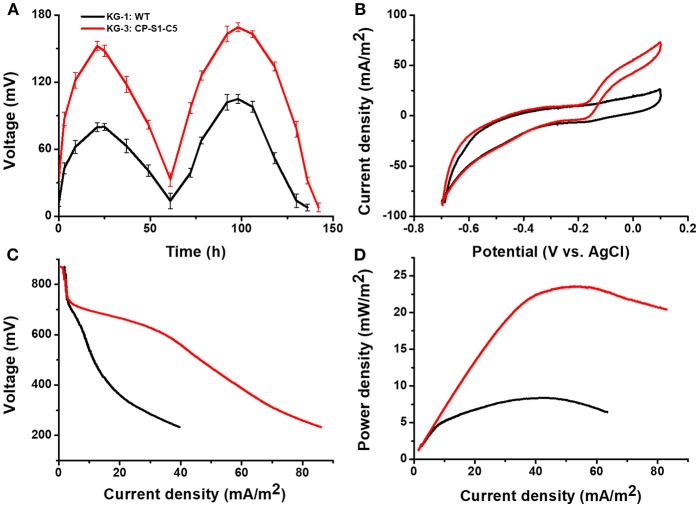
Figure 5.
Electrochemical analysis of the performances of microbial consortia in the cellulose hydrolyzates-fed MFCs. MFC output voltage profiles produced by KG-3: CP-S1-C5 under cellulose hydrolyzates feedstock anolyte. (A) Voltage output in the multiple operational cycles. (B) Turnover cyclic voltammetry (CV) curves at a scan rate of 1 mV/s. (C) MFC polarization curves obtained by linear sweep voltammetry (LSV) with a slow scan rate of 0.1 mV/s. (D) MFC power density output curves calculated on the basis of the corresponding polarization curves.

