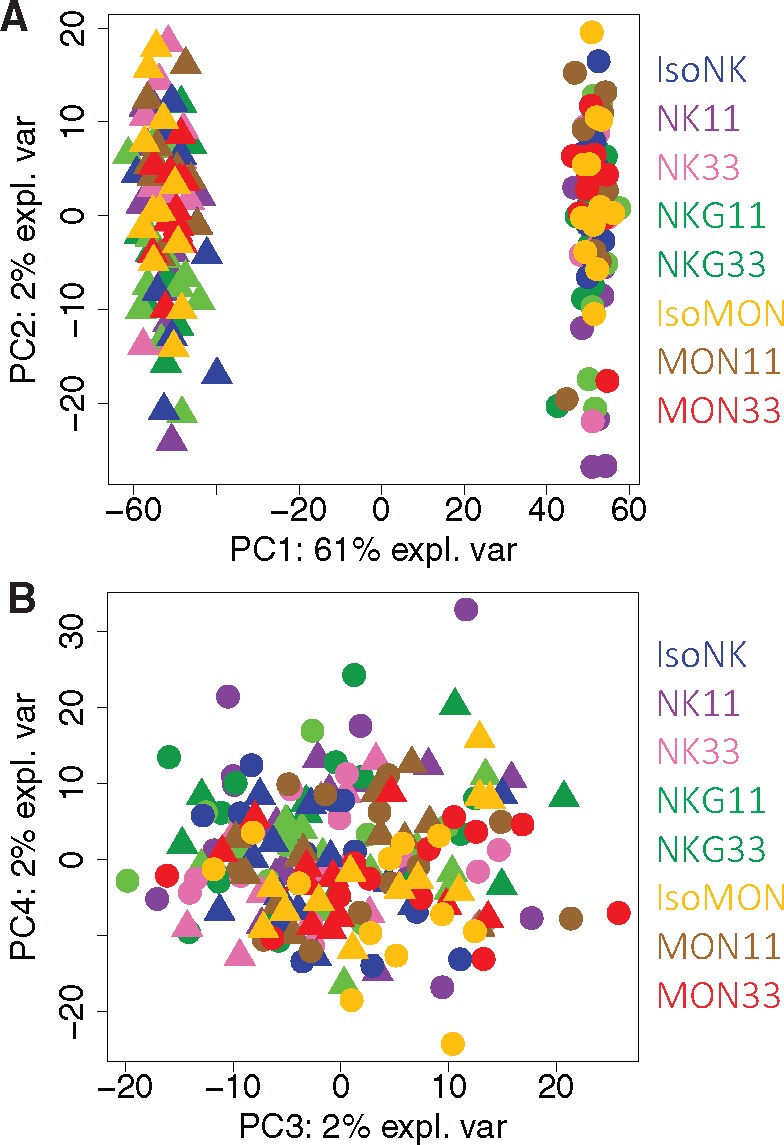
Figure 4.

Principal component analysis using data generated with liver mRNA of rats sacrificed at T180. Each diet is identified by a specific color and correspondence is shown in Table 2. Each female is identified with a triangle whereas each male is identified with a circle. A, The first 2 principal components explaining variability are represented on x-axis (PC1) and y-axis (PC2). A clear separation between males (circles) and females (triangles) is observed (PC1: 61% explained variability). B, The second and third principal components explaining variability are represented on x-axis (PC3) and y-axis (PC4). No clustering effect of the different diets is observed.
