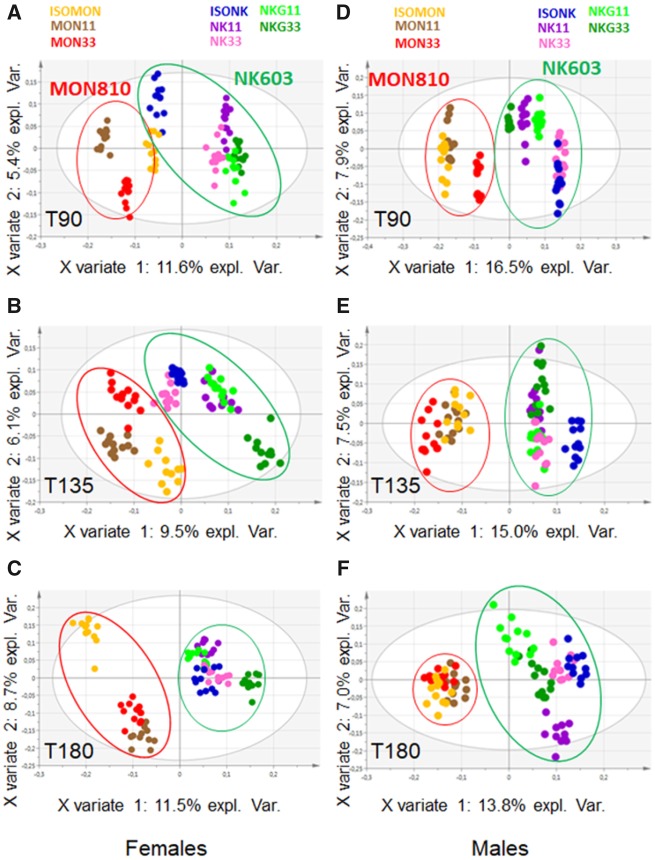
Figure 7.
Partial least squares-discriminant analysis between 8 diets based on urine metabolome variables at T90 (A, D), T135 (B, E), and T180 (C, F); (A–C) females and (D–F) male rats. A clustering is observed on the x-axis with a clear separation between both MON810 (left) and NK603 (right) diets.

