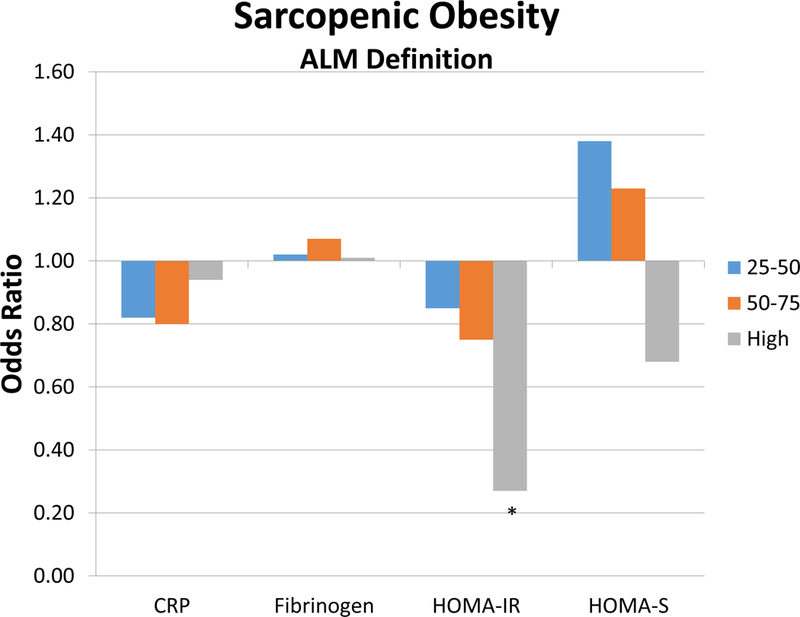
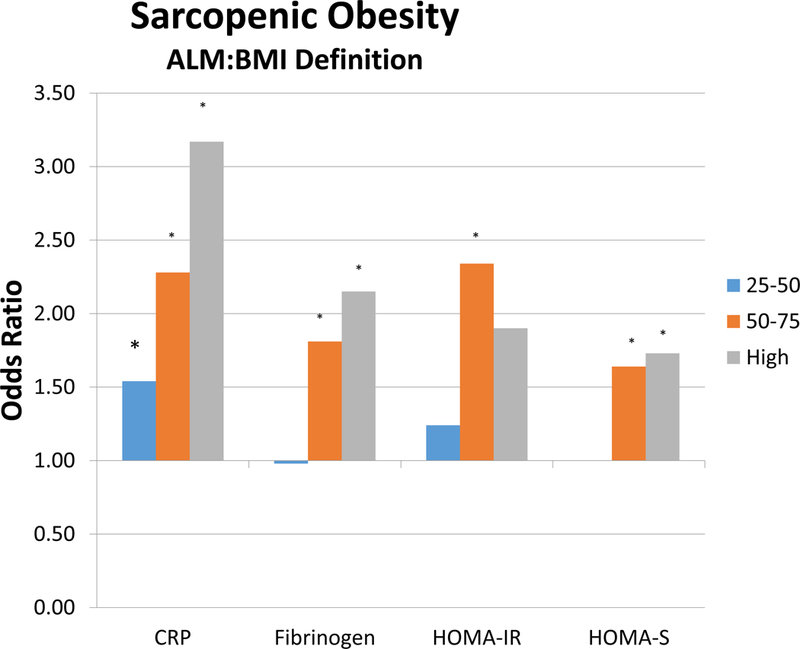
Figure 1:


Figure represents the odds ratios within each variable (C-reactive protein, fibrinogen, HOMA-IR, and HOMA-B) according to quartile. Figure A represents sarcopenic obesity based on the ALM definition, and Figure B represents sarcopenic obesity based on ALM:BMI.
