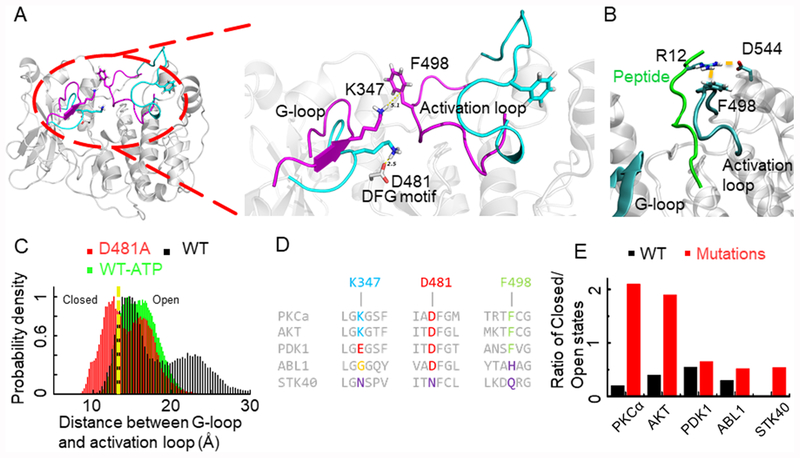
Figure 1.
(A) Representative structure of PKCα showing closed (purple) and open (cyan) conformations. The inset shows the ionic lock between K347 and D481. (B) Average binding conformation of the peptide substrate in which R12 in the C-terminus of the peptide substrate interacts with F498 in the activation loop and D544. (C) Distance distribution histogram for wild-type PKCα, bound with ATP, and the D481A mutant system. The yellow dotted line demarcates the closed (left) and open (right) states. (D) Sequence alignment of the G-loop, DFG motif, and part of the activation loop showing conservation in multiple kinases. (E) Ratio of closed to open states for PKCα, PDK1, AKT, STK40, and wild-type ABL1 protein (black) and the D481 equivalent residue mutated to A (red).

