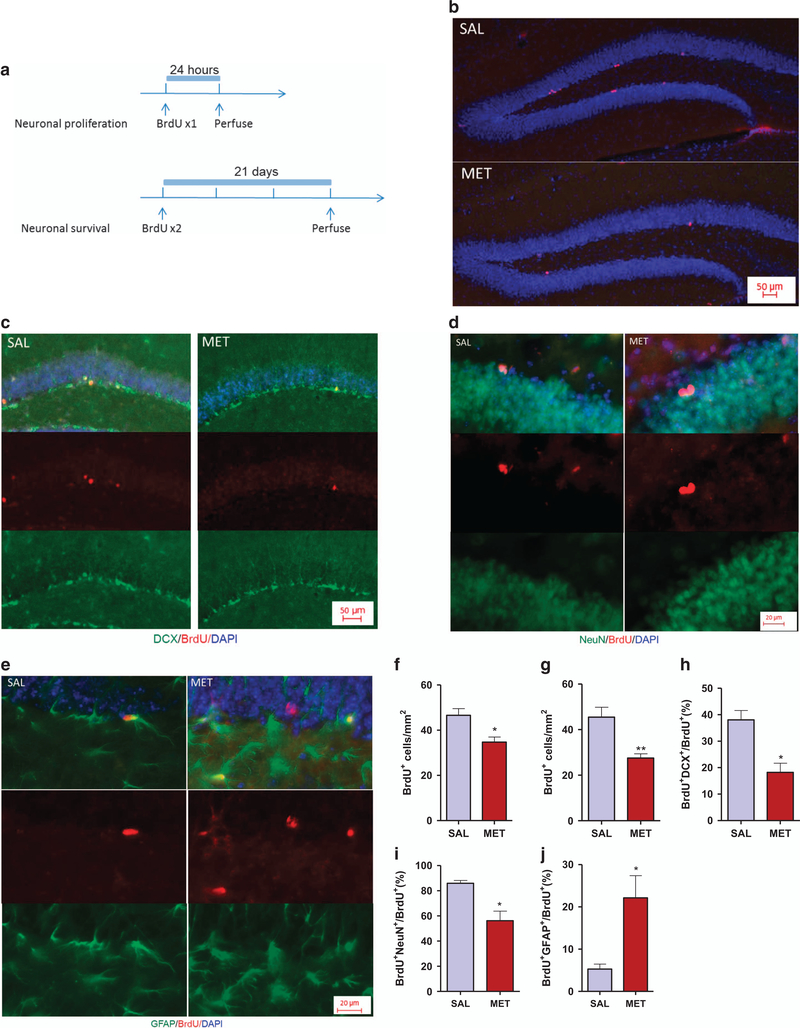
Figure 2.
MET mice display decreased proliferation and differentiation and increased gliogenesis. (a) Experimental design for BrdU administration. (b) Images of the hippocampus dentate gyrus showing BrdU (red) and DAPI (blue) staining at 24 h after injection of BrdU to SAL and MET pups. (c) Images of BrdU+/DCX+ cells showing BrdU and DCX immunoreactivity at 21 days after two BrdU injections. (d) Images of BrdU+/NeuN+ cells showing BrdU and NeuN immunoreactivity at 21 days after two BrdU injections. (e) Images of BrdU+/GFAP+ cells showing BrdU and GFAP immunoreactivity at 21 days after two BrdU injections. (f) Quantification of BrdU-immunopositive cells at 24 h post-BrdU injection (n=3 mice per group). Unpaired student test (t=3.2, P=0.032): SAL versus MET, *P<0.05. Data are presented as means ± s.e.m. (g) Quantification of BrdU-immunopositive cells at 21 days post-BrdU injections (n=3 SAL, 4 MET). Unpaired student test (t=4.2, P=0.0084): SAL versus MET, **P<0.01. Data are presented as means ± s.e.m. (h) Number of new immature neurons (BrdU+/DCX+) in the dentate subgranular zone at 21 days after two BrdU injections (n=3 SAL, 4 MET). Unpaired student test (t=3.92, P=0.011): SAL versus MET, *P<0.05. Data are presented as means ± s.e.m. (i) Number of new immature neurons (BrdU+/NeuN+) in the dentate subgranular zone at 21 days after two BrdU injections (n=3 SAL, 4 MET). Unpaired student test (t=3.38, P=0.012): SAL versus MET, *P<0.05. Data are presented as means ± s.e.m. (j) Number of new astrocytes (BrdU+/GFAP+) in the dentate subgranular zone at 21 days after two BrdU injections (n=3 mice per group). Unpaired student test (t=3.14, P=0.0348): SAL versus MET, *Po0.05. Data are presented as means ± s.e.m.

