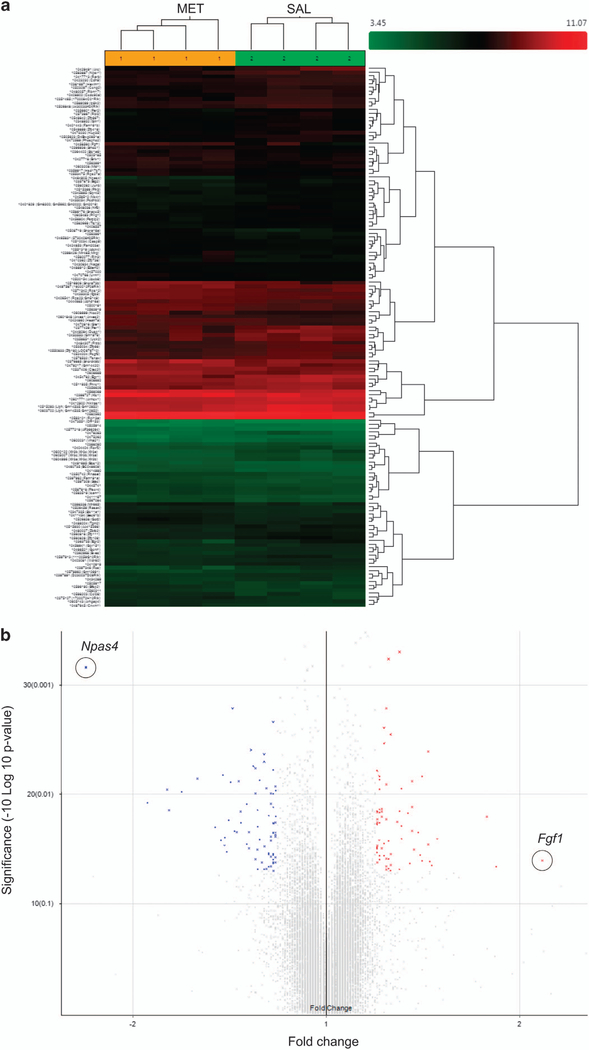
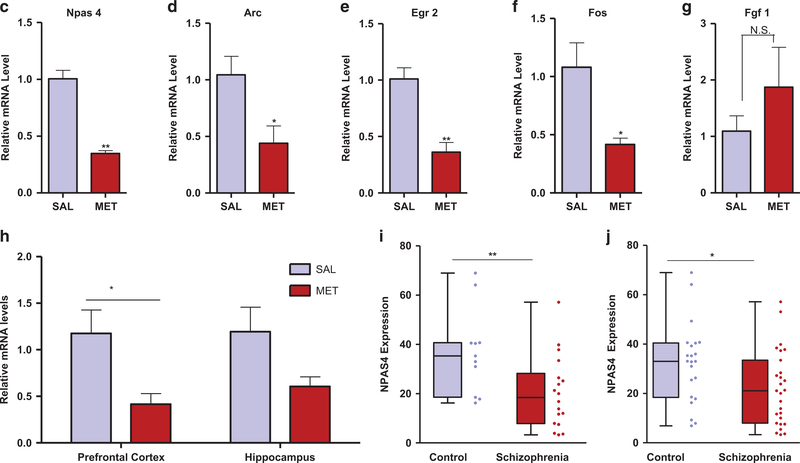
Figure 4.
Downregulation of neuronal immediate early genes in MET mice and human schizophrenics. (a) Hierarchical clustering analysis of differentially expressed genes (>1.2-fold change, P<0.05) in brains from MET versus SAL mice. (b) Volcano plot showing differentially expressed genes in brains from MET versus SAL mice. Npas4 (circled) exhibited the largest expression change among the downregulated genes (blue symbols); Fgf1 (circled) exhibited the largest expression change among the upregulated genes (red symbols). (c-g) Real-time qPCR validation of microarray. Relative global mRNA levels of NPAS4 (c), Arc (d), Egr2 (e), Fos (f) and Fgf1 (g) genes in the mice brain assessed by quantitative real-time PCR (n= 3–4). Unpaired student test (Npas4: t =8.444, P =0.0011; Arc: t=2.684, P=0.0363; Egr2: t =4.977, P=0.0042; Fos: t=3.05. P=0.037, Fgf1: t=1.026, P= 0.3444): SAL versus MET, *P<0.05, **P<.01, NS, not significant. Data are presented as means ± s.e.m. (h) qT-PCR analysis of NPAS4 mRNA expression in the prefrontal cortex (n=7), hippocampus (n= 7 SAL, 6 MET). Two-way ANOVA revealed a significant drug effect (F1,23 = 10.9, P=0.0123) but no significant subregional effect (F1,23 = 0.25, P40.05) followed by Bonferroni post hoc test: SAL versus MET in the prefrontal cortex, (t= 2.686, P<0.05), SAL versus MET in the hippocampus, (t= 1.99, P40.05). *P<0.05, Data are presented as means ± s.e.m. Data are presented as means ± s.e.m. (i, j) Npas4 mRNA expression in the anterior prefrontal cortex (Brodmann Area 10) of post-mortem patients with schizophrenia and control subjects. Box and whisker plot of gene expression of (i) male (n =18 male patients and 11 male matched controls) and (j) total (n=27 schizophrenia patients and 22 matched controls), Empirical Bayes moderated t-test (male: P= 0.007, total: P= 0.0189): control versus schizophrenia, *P<0.05, **P<0.01.


