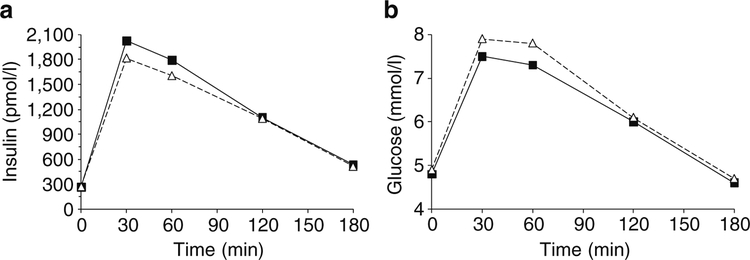
Fig. 2.
Plasma concentrations of insulin (a) and glucose (b) after a 75 g OGTT in 266 participants with normal glucose tolerance stratified by the presence (squares) or absence (triangles) of HLA-DRB1* 02(1602). After adjusting for covariates age, sex, body fat percentage, 30 min glucose and insulin sensitivity, the 30 min insulin concentration was higher (p=0.017, Table 4) for those with DRB1*02

