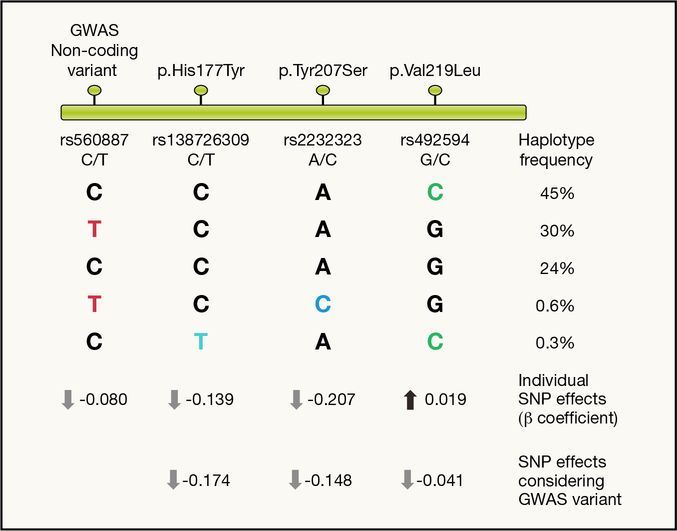
Figure 4 -. Coding variants at G6PC2/ABCB11 locus.
Schematic representation of GWAS and coding variants mapping along the chromosome around the locus (top). Common haplotypes formed by the four variants are represented with their frequency. Coloured letters represent the glucose lowering allele based on in vitro assay results (black letters refer to the glucose raising allele). Estimating the effect of each SNP individually (black/coloured letter in each column) ignoring the background haplotype may lead to incorrect inferences regarding the effect of that variant on glucose levels. This effect is particularly evident for the p.Val219Leu (MAF=48%) where single SNP analysis estimates the effect of this variant to increase glucose levels, whereas functional data show it decreases glucose levels. When the effect of this variant is estimated conditioning on the effect of the GWAS index variant (i.e. taking account of its effect on glucose levels) it becomes apparent that Leu219 decreases glucose levels. These results are in agreement with in vitro results where p.Val219Leu was shown to decrease protein expression levels by 49%, in comparison to a 99% reduction (p.His177Tyr) and 100% reduction (Tyr207Ser) for the other two coding variants. This striking difference on protein expression levels is in agreement with the much more modest effects on fasting glucose for p.Val219Leu compared to the two other variants.

