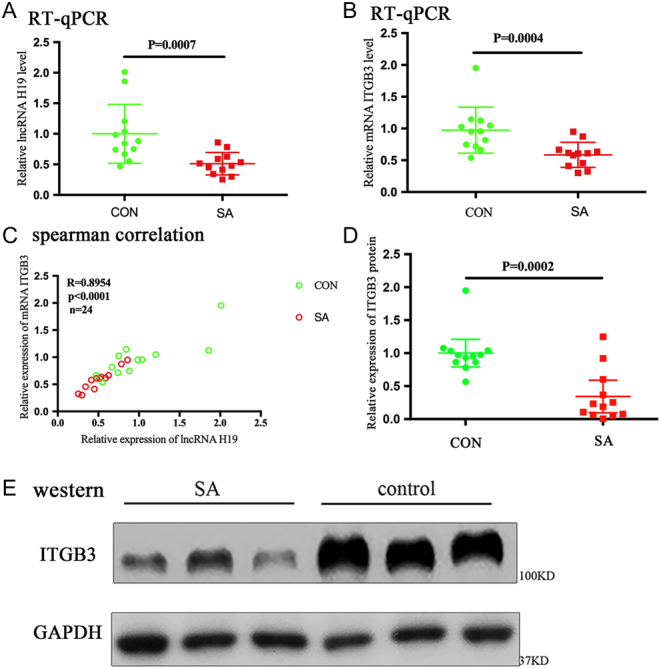
Figure 5.

The expressions of H19 and integrin β3 (ITGB3) decrease in human embryonic chorion tissue of spontaneous abortion. (A and B) Scatter plot of the RNA levels on RT-qPCR shows that the relative expressions of H19 and ITGB3 significantly decrease in the SA group. The horizontal line represents the group median, and the whiskers represent the interquartile range. (C) Spearman correlation suggests a significant in vivo positive correlation between the expressions of H19 and ITGB3. The Spearman correlation coefficient, P values, and sample numbers are indicated on the upper left of the plot. (D) Scatter plot of the protein levels on Western blot analysis is shown. The horizontal line represents the group median, and the whiskers represent the interquartile range. (E) The relative expression level of ITGB3 protein in the two groups is shown. GAPDH is used as an internal control.

 This work is licensed under a