Figure 1.
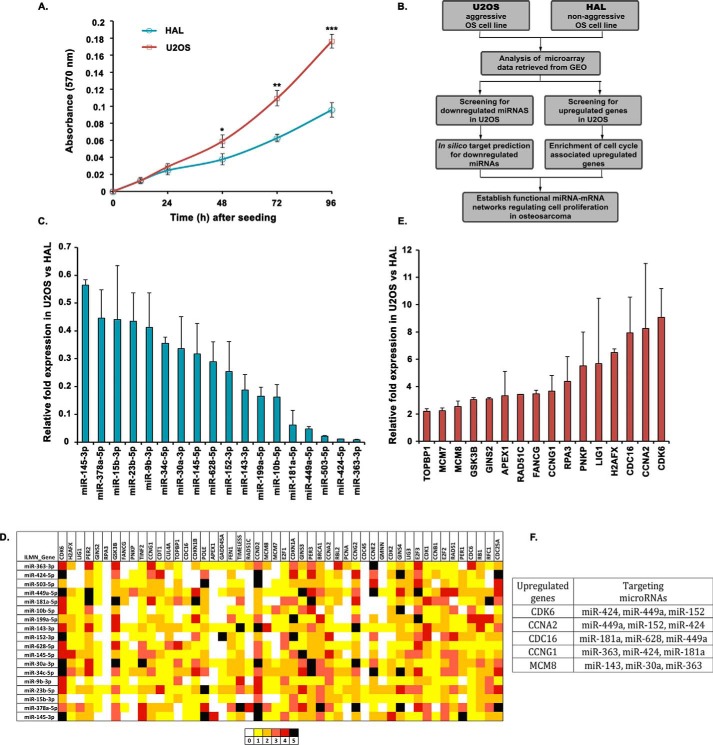
A screen to identify novel miRNA–mRNA interactions in osteosarcomas. A, MTT proliferation assay to compare the growth rate of U2OS and HAL cell lines. The absorbance at 570 nm reflects the proportion of viable cells for each cell line at the indicated time interval. The data represent the mean of three technical replicates ± S.D. (error bars). p values calculated using a two-tailed t test show that U2OS samples are significantly different from HAL samples (*, p < 0.05; **, p < 0.01; ***, p < 0.001). B, schematic outline describing the strategy for identifying novel miRNAs regulating cell proliferation by comparing the expression of miRNAs as well as cell cycle–associated genes in two osteosarcoma cell lines, U2OS and HAL, differing in their growth aggressiveness. C, relative expression of 18 selected miRNAs in U2OS cells as compared with HAL cells, evaluated by individual quantitative real-time PCR. Small nucleolar RNA, RNU66, was used as the endogenous control for normalization of miRNA expression in the two cell lines. D, in silico analysis for identification of novel miRNA–mRNA pairs regulating cell proliferation in aggressive osteosarcoma. The heat map represents a matching of the up-regulated cell cycle genes with down-regulated miRNAs in U2OS using five different bioinformatics tools for miRNA target predictions, including TargetScan, miRanda, miRWalk, RNA22, and RNAhybrid. The colors represent the number of algorithms that predict a specific gene (arranged horizontally) as a target of the respective miRNA (arranged vertically). E, relative expression of cell cycle–associated genes in U2OS cells as compared with HAL cells, evaluated by individual quantitative real-time PCR. Housekeeping gene, β2-microglobulin, was used as the endogenous control for normalization of gene expression in the two cell lines. F, list of key cell cycle regulatory genes that are overexpressed in an aggressive osteosarcoma cell line, U2OS, and the miRNAs that are predicted to target them. For expression levels of miRNA/mRNA, the data are represented as the mean of two experiments, each with two technical replicates, ± S.D.

