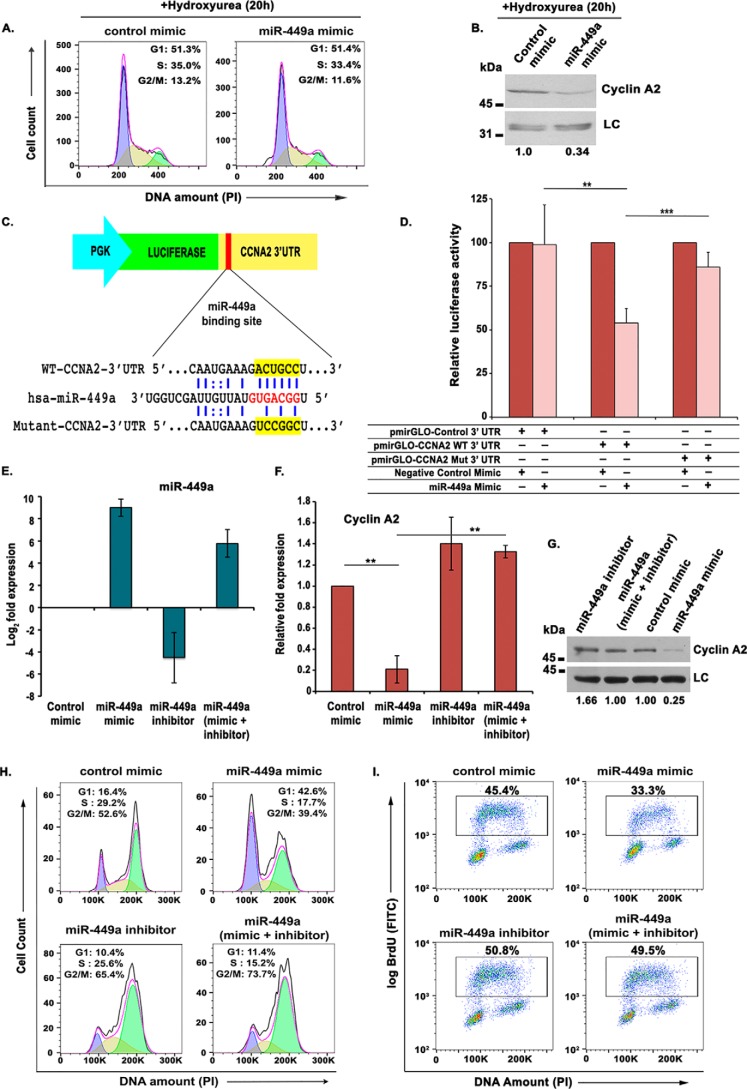
Figure 3.
miR-449a targets the 3′-UTR of CCNA2, impeding DNA synthesis. A, U2OS cells transfected twice with either control or miR-449a mimic followed by incubation with 2 mm hydroxyurea for 20 h and PI staining for analysis of cell cycle distribution by flow cytometry. The different colors mark the G1, S, and G2/M phases, whereas the inset shows the distribution of cells in different phases of the cell cycle. B, immunoblotting of cyclin A2 in U2OS cells transfected with either control mimic or miR-449a mimic as described in A. C, an illustration of miR-449a binding with WT and mutant CCNA2 3′-UTR, cloned downstream of the firefly luciferase gene under the control of the PGK promoter in pmirGLO Dual-Luciferase vector. D, CCNA2 3′-UTR possessing the WT or mutant (Mut) binding site for miR-449a cloned in pmirGLO Dual-Luciferase vector was cotransfected in U2OS cells with control or miR-449a mimic, as indicated, and the relative luciferase activity was determined. The data are represented as the mean of six experiments ± S.D. (error bars). E–G, U2OS cells were transfected on 3 consecutive days with control mimic, miR-449a mimic, or miR-449a inhibitor, as indicated, and miR-449a, CCNA2 mRNA, and protein levels were analyzed. LC, loading control, a nonspecific band that displays equal protein load in different lanes. The numbers indicate levels of cyclin A2 relative to control mimic–transfected cells. H, flow cytometry of propidium iodide-stained transfected cells demonstrates that restoration of CCNA2 by miR-449a inhibitor releases the G1 arrest caused by miR-449a mimic. U2OS cells transfected on three consecutive days, as described in E, were treated with nocodazole for 16 h before staining with propidium iodide followed by a flow cytometry assay for determining the cell cycle phase distribution of transfected cells. I, U2OS cells transfected on 3 consecutive days were pulsed with BrdU for 30 min after 24 h of the third transfection and stained with FITC-conjugated anti-BrdU antibody along with propidium iodide, followed by a flow cytometry assay for BrdU incorporation. The dot plot displays BrdU incorporation (y axis) and DNA content (x axis), and the inset shows the percentage of cells incorporating BrdU. For expression levels of miRNA/mRNA, the data are represented as the mean of two experiments, each with two technical replicates, ± S.D. *, p < 0.05; **, p < 0.01; ***, p < 0.001.

