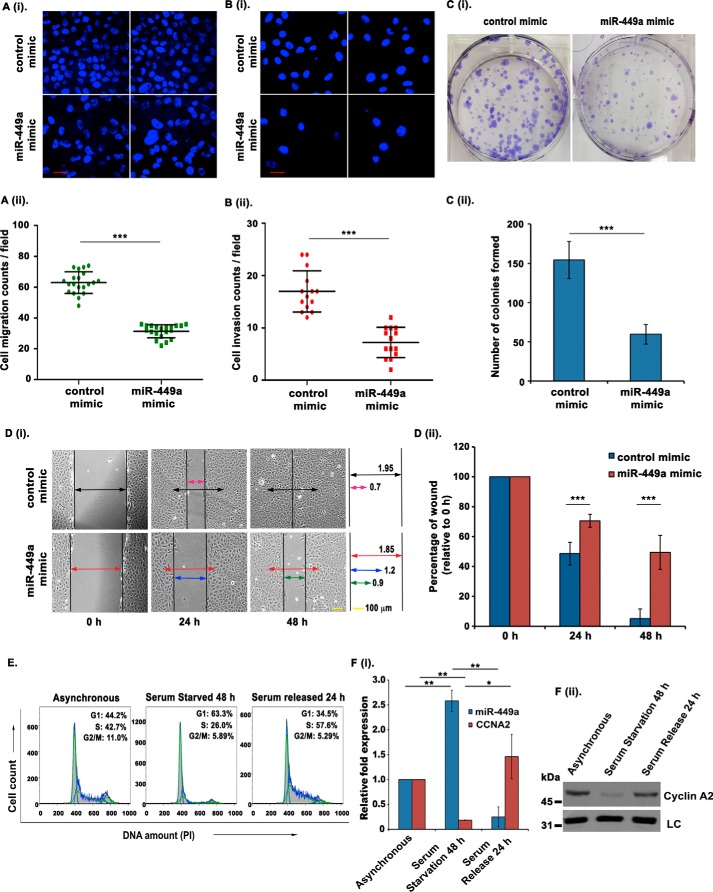
Figure 4.
miR-449a overexpression inhibits tumorigenic phenotypes. A (i and ii), U2OS cells were transfected on 3 consecutive days with either control mimic or miR-449a mimic, and the cells migrating through a microporous membrane were counted 24 h after the third transfection. i, representative fields showing DAPI-stained nuclei of migrated cells. ii, quantification of the migratory cells observed in i. Each point refers to the number of cells in an individual field, whereas long and short horizontal bars represent the mean and S.D. (error bars) of all fields, respectively. Scale bar, 20 μm. B (i and ii), U2OS cells were transfected as described in A, and the cells invading through a Matrigel-coated membrane were counted at 24 h after the third transfection. i, representative fields of each sample showing the DAPI-stained nuclei of invading cells. ii, quantification of the invading cells as described in A. C (i and ii), clonogenic assay to evaluate the effect of miR-449a expression. i, U2OS cells were transfected on 3 consecutive days with either control or miR-449a mimic, allowed to grow for 12 days, and stained with crystal violet, after which the colonies were counted. ii, quantification of i, which demonstrates that the colony-forming ability is significantly reduced upon miR-449a overexpression. The data are represented as the mean of six experiments ± S.D. D (i and ii), wound-healing assay to evaluate the effect of miR-449a overexpression on cell migration: U2OS cells were transfected on two consecutive days with either control or miR-449a mimic and grown to confluence, after which a wound was created using a micropipette tip. The extent of wound healing was monitored every 24 h. Arrows of different colors represent the relative width of the wound at different time points in different samples. ii, quantification of i (units), which demonstrates that the wound-healing capability is profoundly reduced upon miR-449a overexpression. The data are represented as the mean of two experiments ± S.D. E and F, U2OS cells were serum-starved for 48 h, followed by resupplementation with serum for 24 h. E, flow cytometry of PI-stained DNA representing the cell cycle phase distribution after serum starvation and resupplementation in U2OS cells. F (i), relative expression of miR-449a and CCNA2 mRNA in asynchronous, serum-starved, and serum-resupplemented U2OS cells determined using qRT-PCR and normalized with the expression of RNU48 and BMG, respectively. F (ii), immunoblotting of the same samples as described in E shows differential expression of CCNA2 after serum starvation and serum resupplementation. For expression levels of miRNA/mRNA, the data are represented as the mean of two experiments, each with two technical replicates, ± S.D. *, p < 0.05; **, p < 0.01; ***, p < 0.001.

