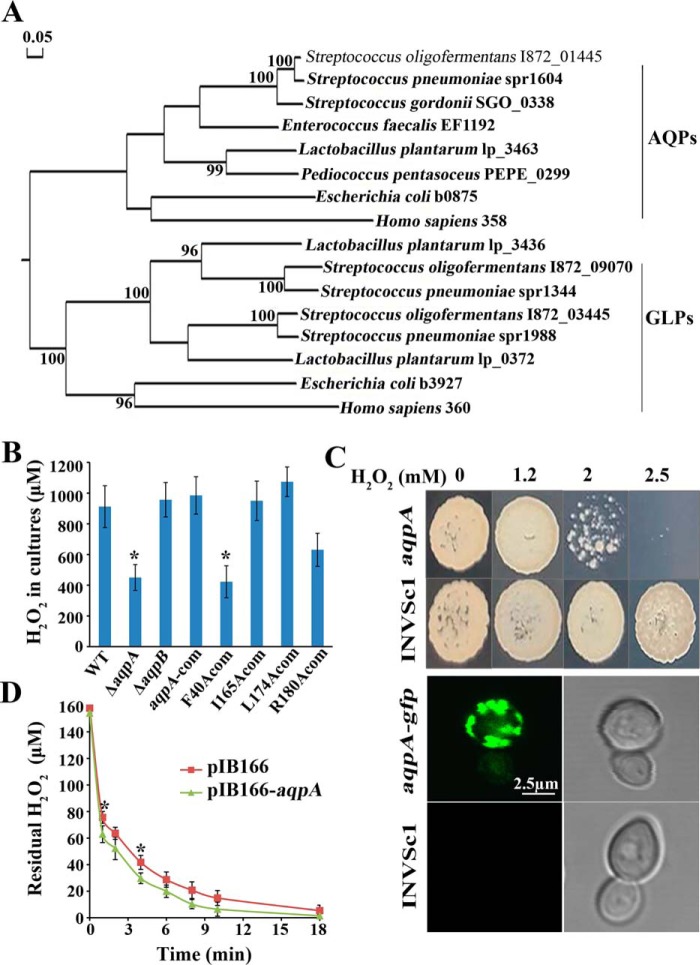
Figure 1.
An aquaporin homolog So-aqpA encodes a H2O2 facilitator. A, phylogenetic analysis was performed for the S. oligofermentans aquaporin (I872_01445) and aquaglyceroporins (I872_09070 and I872_03455) with the homologs from representative lactic acid bacteria, E. coli, and humans. Protein sequences were retrieved from the NCBI protein database. The phylogenetic tree was constructed with DNAMAN using the neighbor-joining method and the bootstrap value was set as 1000. The bar of 0.05 represents the evolution distance. B, the WT strain, deletion mutants of So-aqpA and So-aqpB, and various point-mutated So-aqpA strains were cultured in 10-ml BHI broth in a 100-ml flask, and H2O2 yields in the stationary phase cultures were determined. The average ± S.D. from triplicate cultures of each strain are shown. *, data are statistically significant compared with those of the WT strain and the So-aqpA point mutation strains, as verified by one-way ANOVA followed by Tukey's post hoc test (p <0.05). C, the So-aqpA gene either fused with the sfGFP gene or alone was integrated into the pYES2 plasmid and transformed into S. cerevisiae INVSc1. The INVSc1-So-aqpA, -So-aqpA-gfp, and -pYES2 strains were grown in SC-Ura-glucose for overnight, and then shifted to galactose to induce the So-aqpA gene expression. After a 6- to 8-h induction, 10 μl diluted INVSc1-So-aqpA and -pYES2 cultures (OD600 0.01) were spotted on SC-Ura galactose agar plate which is supplemented with various concentrations of H2O2 (upper panel). The INVSc1-So-aqpA-gfp and -pYES2 cells were visualized under a confocal laser scanning microscope (Leica TCS SP8, Leica Microsystems) with excitation at 488 nm, and emission was collected from a range of 500 to 600 nm (lower panel). The representative GFP fluorescence (left) and differential interference contrast pictures (right) were shown. D, the So-aqpA gene was cloned into pIB166 and heterogeneously expressed in E. coli. Mid–exponential phase LB cultures (OD600 ∼0.60) of the pIB166-aqpA and vacant pIB166 strains were collected by centrifugation and washed twice with PBS. Cells were then diluted into 10 ml PBS to OD600 0.1, and a final concentration of 150 μm H2O2 was added. The residual H2O2 in PBS was then determined at the indicated time points. Average ± S.D. of triplicate experiments is shown. *, data were statistically significantly different from that of pIB166-aqpA strain at the corresponding time point (Student's t test, p <0.05).

