Figure 7.
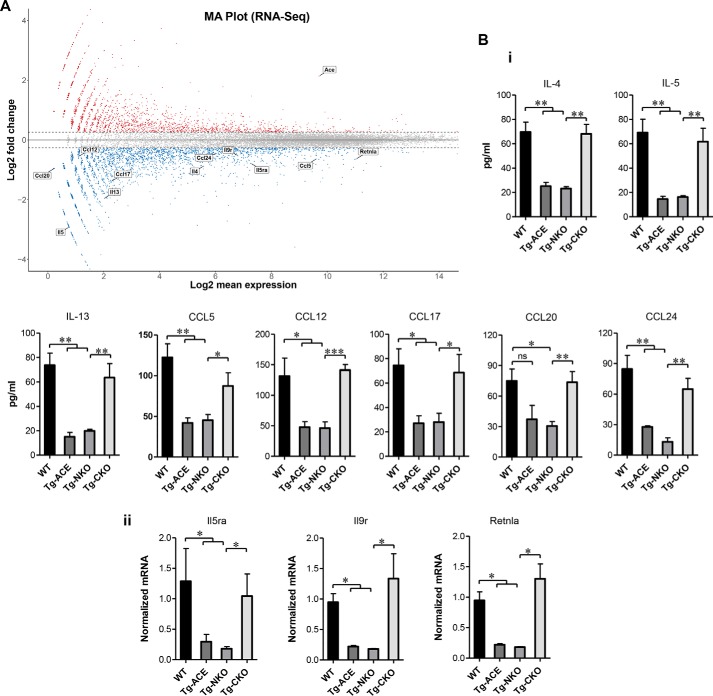
Basal expression of M2 macrophage markers. A, MA plot for RNA-Seq. Total RNA was extracted from purified peritoneal macrophages of WT and Tg-ACE mice, and next generation sequencing was performed to measure gene expression (n = 4/group). Shown is an MA plot comparing Tg-ACE macrophages to WT macrophages. Values on the x axis are the log 2 mean expression values of a gene, whereas the y axis shows the log 2 of the fold change in expression values where increased expression in Tg-ACE is indicated by a positive number. Tg-ACE macrophages showed down-regulation of the M2 macrophage genes IL-4, IL-5, IL-13, Ccl5, Ccl12, Ccl17, Ccl20, Ccl24, IL-5ra IL-9r, and Retnla. B, confirmation of basal M2 gene expression. Peritoneal macrophages were isolated from WT, Tg-ACE, Tg-NKO, and Tg-CKO mice, and cultured as described under “Experimental procedures.” Panel i, the production of cytokines was determined in the macrophage supernatant by ELISA (n = 4/group). Panel ii, measurement of gene expression by real-time qRT-PCR (n = 4/group).

