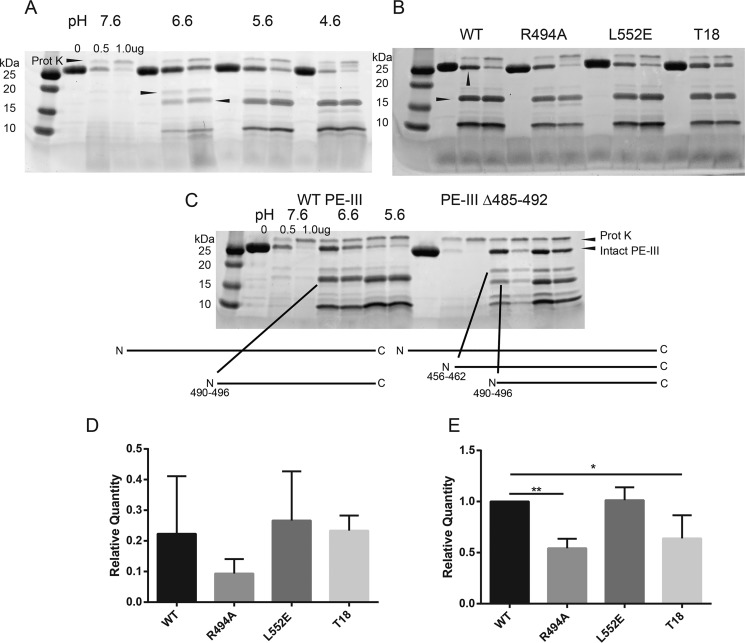
Figure 3.
Limited proteolysis of PE-III variants demonstrates folding stability influences proteolytic susceptibility. A, limited proteolysis of WT PE-III with proteinase K (Prot K). The indicated amount of protease was incubated with WT PE-III for 15 min at 37 °C at the indicated pH prior to analysis by SDS-PAGE and Coomassie staining. Arrowheads indicate the fragments selected for analysis by MS. B, limited proteolysis of PE-III variants with proteinase K at pH 5.6. Arrowheads indicate the bands analyzed in D (top) and E (bottom). C, limited proteolysis of WT and Δ485–492 PE-III with proteinase K at the indicated pH. Arrowheads indicate locations of proteinase K cleavage sites in either variant detected by MS. D, mean relative quantity of the intact PE-III variant after proteolysis with 0.5 μg of proteinase K as compared with the undigested lane. Error bars indicate standard deviation (n = 3). E, mean relative quantity of the major 15-kDa fragment of PE-III variant after proteolysis with 0.5 μg of proteinase K, as compared that of WT PE-III. Error bars indicate standard deviation, and asterisks indicate significance by one-way ANOVA (n = 3).

