Figure 1.
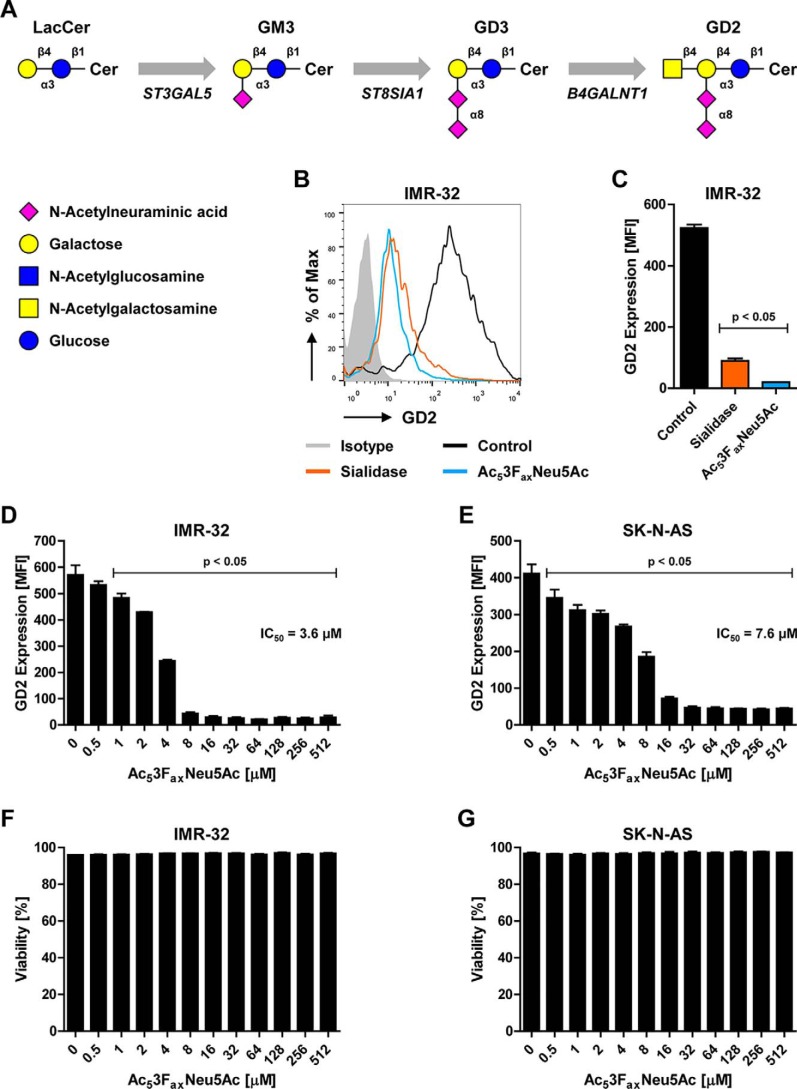
Recognition of GD2 by the 14G2a antibody is sialic acid dependent. A, schematic representation of the GD2 biosynthesis pathway. B and C, binding of the anti-GD2 antibody 14G2a to control or sialidase- or Ac53FaxNeu5Ac-treated IMR-32 cells. A representative histogram shows GD2 expression as detected by flow cytometry (B), and the bar diagram shows GD2 expression as mean fluorescence intensity ± S.E. of three independent experiments (C). D and E, effect of metabolic sialic acid inhibition on GD2 expression. Bar diagrams show GD2 expression as mean fluorescence intensity ± S.E. on IMR-32 cells (D) and SK-N-AS cells (E) treated with 0–512 μm Ac53FaxNeu5Ac for 3 days (n = 3). F and G, effect of Ac53FaxNeu5Ac on cell viability. Bar diagrams show mean percentage of viable cells ± S.E. in the IMR-32 (F) and SK-N-AS (G) cultures after treatment with 0–512 μm Ac53FaxNeu5Ac for 3 days (n = 3).

