Figure 3.
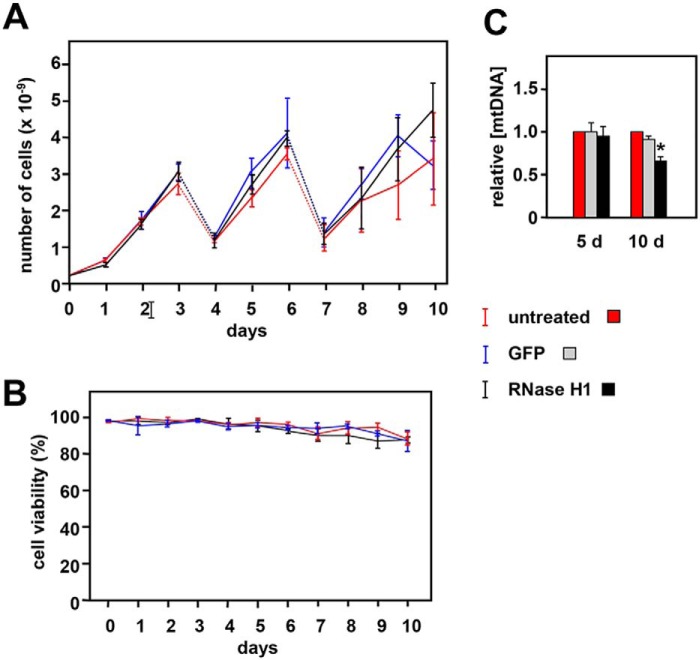
Effects of rnh1 knockdown in S2 cells. A, growth curves for untreated S2 cells or cells treated with dsRNA against rnh1 (RNase H1) or an inert dsRNA against GFP as indicated. Cells were split 1:6 on days (d) 3 and 6 with addition of fresh aliquots of dsRNA (dotted lines). Values are means for three independent replicates in each case. Error bars denote S.D. B, cell viability (trypan blue exclusion) for the same cell cultures. C, mean relative mtDNA copy number for the indicated cells, normalized against the value for untreated cells in parallel cultures. Error bars denote S.D. * denotes significant difference from untreated cells (Student's t test, p < 0.01, n = 3). Cells grown for 10 days were seeded at lower density (105 cells/ml instead of the standard 106/ml) with dsRNA added on days 0, 3, 5, and 8.

