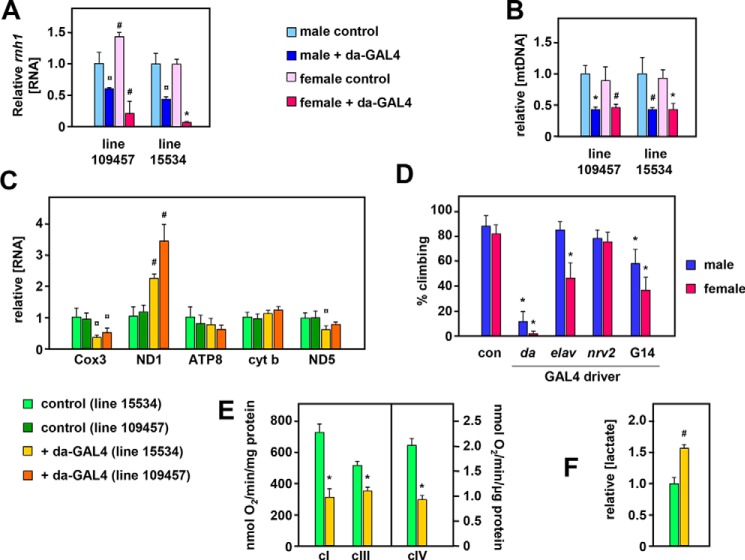
Figure 4.
Effects of rnh1 knockdown in flies. Relative rnh1 transcript (A) and mtDNA copy number (mean ± S. D.) (B) in 2-day-old rnh1 knockdown flies and corresponding controls (i.e. with balancer in place of the da-GAL4–bearing chromosome). Data are normalized in each case against male control flies. Significance values as indicated (Student's t test, comparing knockdown flies with controls of the given sex and RNAi strain, n = 4 in all cases). C, relative levels of transcripts (means + S.D.) of the indicated mitochondrial genes in 2-day-old female flies of the indicated knockdown strains versus balancer controls from the same strains. All data are normalized to values from controls of strain 15534. Significance values are as indicated (Student's t test, comparing knockdown flies of each RNAi strain with controls of the same strain, n = 4 in all cases). D, climbing index (54) of adult flies of the indicated sex, knocked down for rnh1 (strain 15534) using the indicated GAL4 drivers. Values are means ± S.D. of nine independently tested batches of flies in each case. Significant differences are indicated (from control flies of the same sex; Student's t test). Note that because the elav-GAL4 driver is located on chromosome X, it was present only in female progeny; the males are therefore a control for this driver. E, oxygen consumption rates of mitochondrial suspensions from 10-day-old knockdown males of da-GAL4–driven RNAi line 15334 and controls of the same line, supplied with complex I (cI)-, III (cIII)-, and IV-linked (cIV) substrates. Values are means ± S.D. (n = 4, significant differences as shown between controls and knockdown flies). F, lactate levels in homogenates from 10-day-old knockdown males of da-GAL4–driven RNAi line 15334 and controls of the same line, normalized to protein content and then to the value from control flies. Values are means ± S.D. (n = 3, significant differences as shown, between controls and knockdown flies). All statistical comparisons are based on Student's t tests (unpaired, two-tailed) with p values denoted as ¤, hash sign (#), and * (<0.05, 0.01, and 0.001, respectively). con, control; cyt b, cytochrome b.

