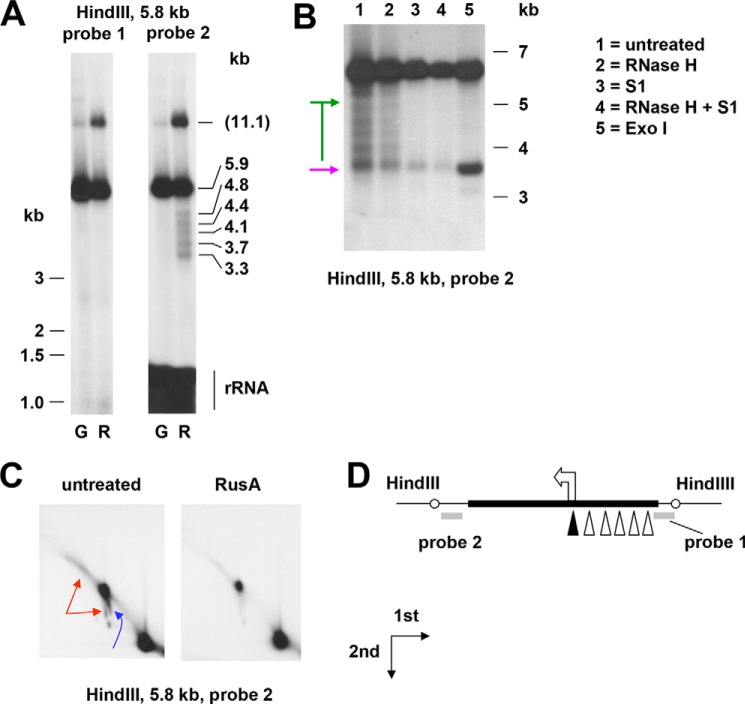
Figure 6.
rnh1 knockdown leads to fork regression. A–C, Southern blots of mtDNA (mitochondrial nucleic acid) extracted from rnh1 knockdown cells (B, C, and lanes denoted “R” in A) or control cells treated with an inert dsRNA against GFP (lanes denoted “G” in A), digested, and probed as indicated. In A, the migration of molecular weight markers of <3 kb is shown to the left, and extrapolated sizes of the bands are shown to the right, based on markers of >3 kb. Markers of 3 kb and above are shown to the right of B. Note that in the region below 1.5 kb, probe 2 also detected 16S rRNA. One-dimensional (A and B) and two-dimensional (C) agarose gels are shown. <1n fragments in B are denoted by a purple arrow (nuclease-resistant) or green bar/arrows (nuclease-sensitive). In C, higher molecular weight nonlinear forms are denoted by red arrows (flying, slow-moving Y-like arc) and blue arrows (burst bubbles and an arc in the shape of an apostrophe, extending downward from them). The directions of first- and second-dimension electrophoresis are as shown. D, schematic map of the region analyzed, showing location of probes (bold gray lines), NCR (bold black line), replication origin (arrowhead), and inferred ends of <1n fragments detected by probe 2 (open triangles; filled triangle for the nuclease-resistant fragment).

