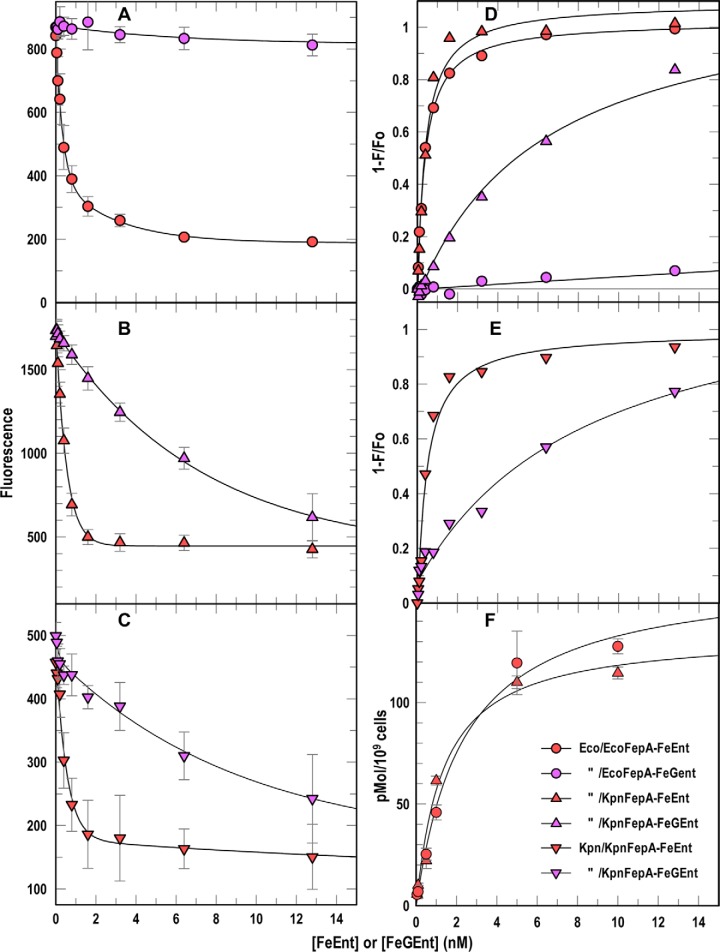
Figure 3.
Binding affinities from spectroscopic assays. A–E, we added FeEnt (red symbols) or FeGEnt (purple symbols) to E. coli OKN13/pEcoFepA-FM (A and D, circles) or OKN13/pKpnFepA-FM (B and D, triangles) or K. pneumoniae KKN4/pKpnFepA-FM (C and E, inverted triangles). A–C, quenching data from this species-specific test quantified binding of the iron complexes. Nonlinear fits of 1 − F/F0 (D and E) using the one-site (with background) equation of Grafit 6.02 revealed the affinities (Kd) of the binding reactions (Table 1). F, [59Fe]Ent binding measurements. We added varying concentrations of [59Fe]Ent to OKN3/pEcoFepA (circles) or OKN3/pKpnFepA (triangles), measured adsorption of the ferric siderophore by filter-binding assays (26), and obtained nonlinear fits to the one-site (with background) equation of Grafit 6.02, which gave the affinities (Kd) of the binding reactions (Table 1). In each panel the error bars represent S.D. of triplicate measurements at each concentration tested.

