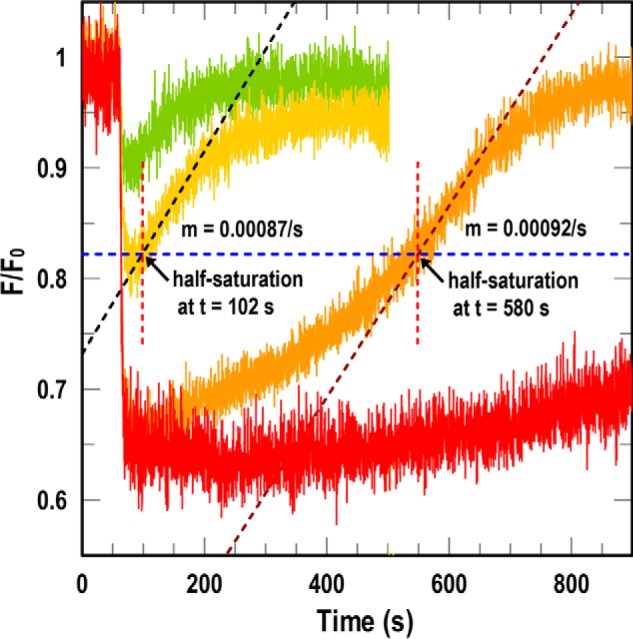
Figure 4.

Uptake rates from FD assays. At t = 60 s we added varying concentrations of FeEnt ((0.5 (green), 1 (yellow), 5 (orange), and 10 nm (red)) to sensor strain OKN13/pEcoFepA-FM in the presence of test strain K. pneumoniae isolate Kp52.145. 10 nm FeEnt gave maximal quenching. For 1 and 5 nm FeEnt, at half-saturation (blue dashed line) we determined the slope of the time course (black dashed line) and the elapsed time (dashed red line). Either parameter estimated the transport rate of the test strain (see text).
