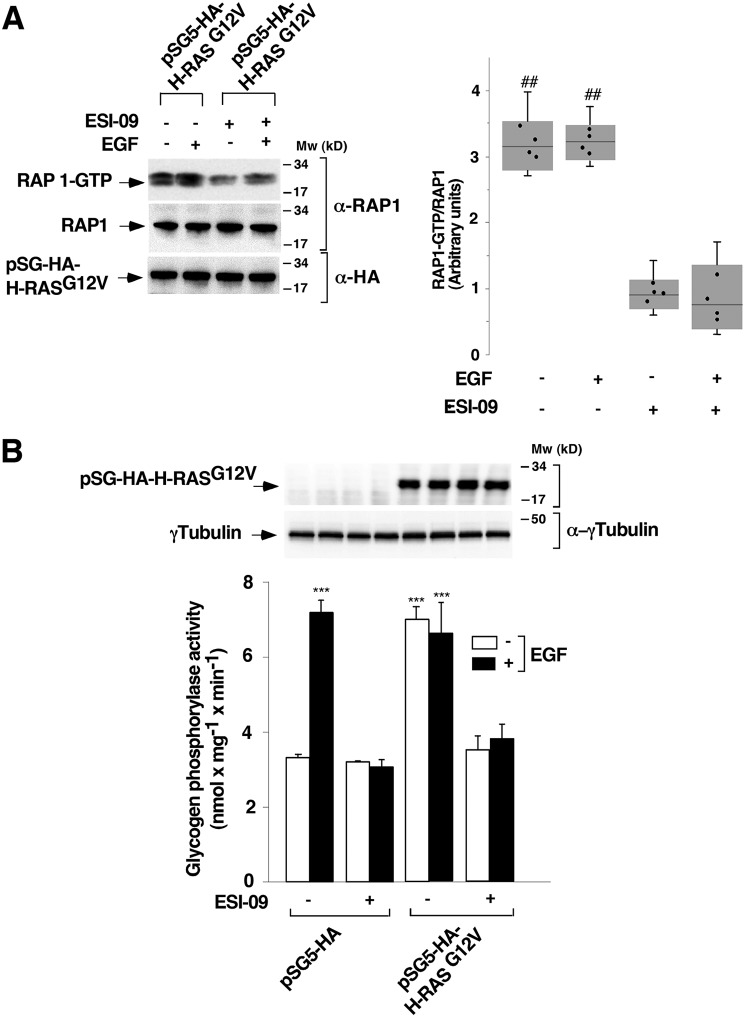
Figure 9.
Epidermal growth factor receptor signaling involves RAS–EPAC–RAP pathway to activate glycogen phosphorylase. T cells deprived of IL-2 for 24 h were transfected with pSG5-HA-H-RASG12V (A) or pSG5-HA-H-RASG12V and pSG5-HA (B). At 24 h post-transfection, the cells were pretreated with 10 μm ESI-09 or vehicle (0.1% DMSO) (−) and stimulated (+) or not (−) with 10 ng ml−1 EGF for 10 min and lysed. A, cell lysates were used to measure RAP1 activation by a pulldown assay. The precipitated active RAP1 (RAP1-GTP) and the total RAP1 from the cell lysates were analyzed by Western blotting using a specific anti-RAP1 antibody. The expression levels of HA-H-RASG12V and tubulin were visualized using anti-HA and anti-γ-tubulin antibodies, as indicated. The results shown are representative of four independent experiments. In the box plot graph, each box includes values from four different samples. All values are expressed in arbitrary units. Differences between different treatments were p < 0.0001 in all cases (##) (Mann–Whitney test). B, cell extracts were used to measure glycogen phosphorylase activity. Protein expression levels were analyzed by Western blotting using specific anti-HA and anti-γ-tubulin antibodies. The results show the mean ± S.D. (error bars) of four independent experiments performed in triplicates. ***, p < 0.001.

