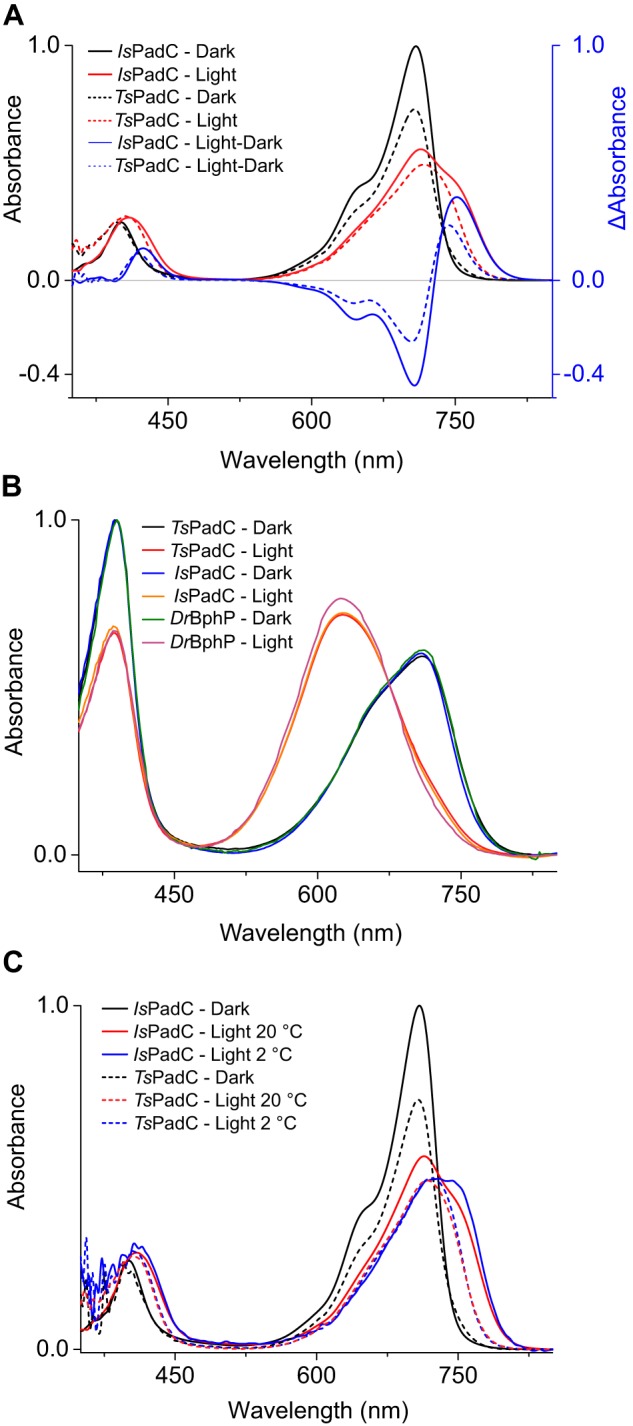
Figure 2.

Comparison of UV-visible absorption spectra of IsPadC and TsPadC. A, superposition of IsPadC (solid lines) and TsPadC (dashed lines) UV-visible spectra, normalized based on the IsPadC Soret-band maximum. Difference spectra of illuminated and dark-state spectrum are represented in blue. B, denaturation in methanol with 0.1% TCA of IsPadC and TsPadC under both dark and illuminated conditions. The same denaturation of DrBphP is shown as a reference of complete ZZEssa formation upon illumination. C, superposition of room temperature (20 °C) and low temperature (2 °C) absorption spectra of IsPadC (solid lines) and TsPadC (dashed lines). Spectra are scaled together based on the Soret peak absorbance.
