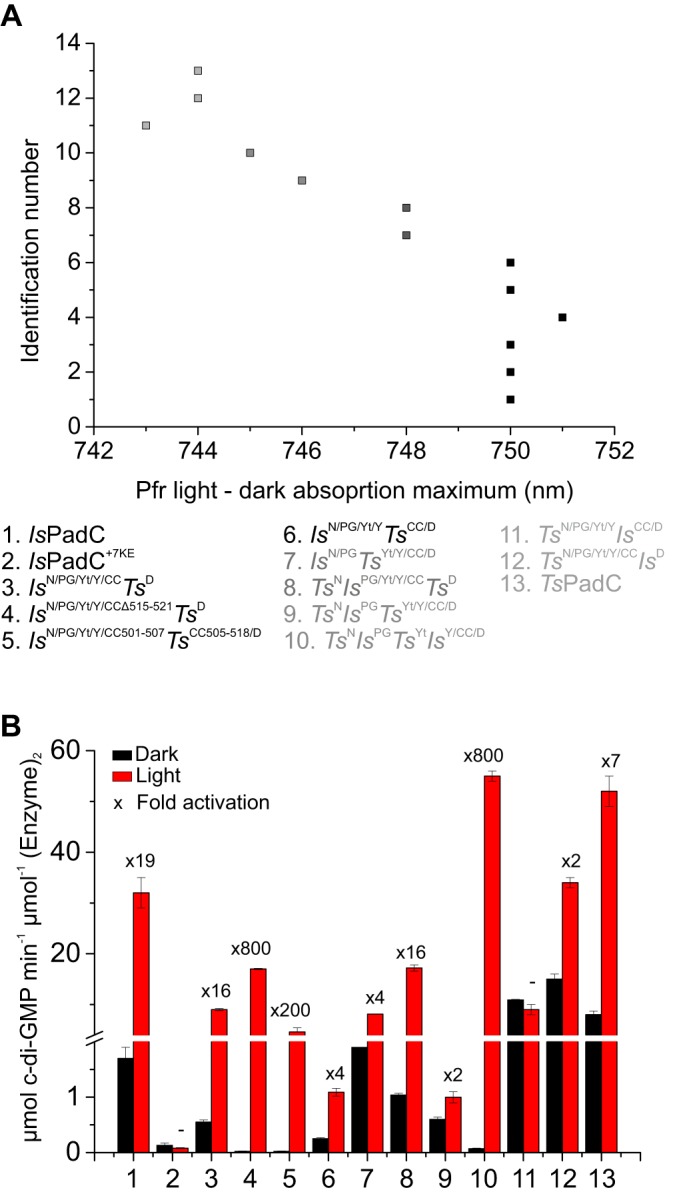
Figure 5.

Regulation capacity of DGC activity. A, maxima of the far-red light absorption derived from the difference between illuminated and dark state spectra of all constructs. B, comparison of apparent turnover rate constants between dark and light conditions at 200 μm GTP. The fold activation is indicated above the columns. Initial rates are quantified from experimental triplicates of three time points, and the sample standard deviation of individual points contributed to the error estimation of the linear fit that is used to calculate the initial rate of product formation. The S.E. of the estimate from the linear regression is used as an error indicator.
