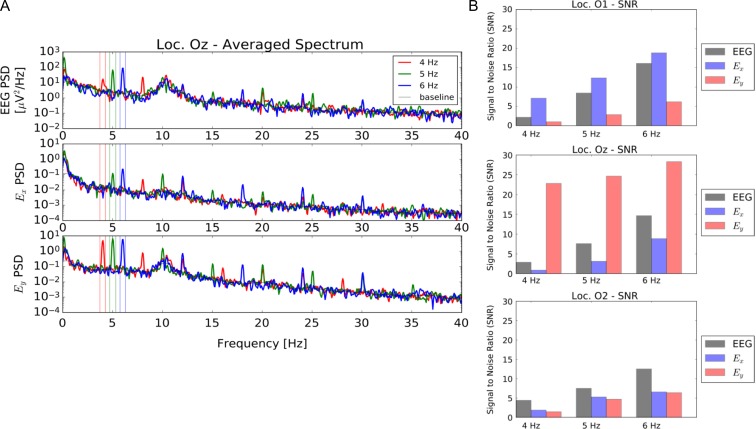
FIGURE 2.
Summary of established results with NeuroDot sensor for reversing black and white checkerboard ssVEP at 4, 5, 6 Hz at O1, Oz, and O2 scalp locations using EEG and new EFEG mode data acquisition. (A) NeuroDot spectral analysis sample for the Oz location, showing peaks in narrow bands around the stimulus frequencies; also more harmonics are visible in the EFEG signal (Ex and Ey components) than in EEG. (B) Measured signal to noise of the fundamental steady state Visual Evoked Potentials peaks for EEG and EFEG (Ex and Ey components) over the three scalp locations. Note that the Ey component shows the strongest overall SNR at Oz, indicating a vertical polarization of electric field; whereas, for O1 the polarization is mostly horizontal and for O2 the polarization is minimal, but may be diagonally oriented. These relative SNR variations are expected vary somewhat among even healthy subjects, though there may be feature patterns that are more general. For instance, the greater Ey polarization of Oz might be explained by the fact that the brain’s interhemispheric cleft is oriented vertically in-line with this electrode position.

