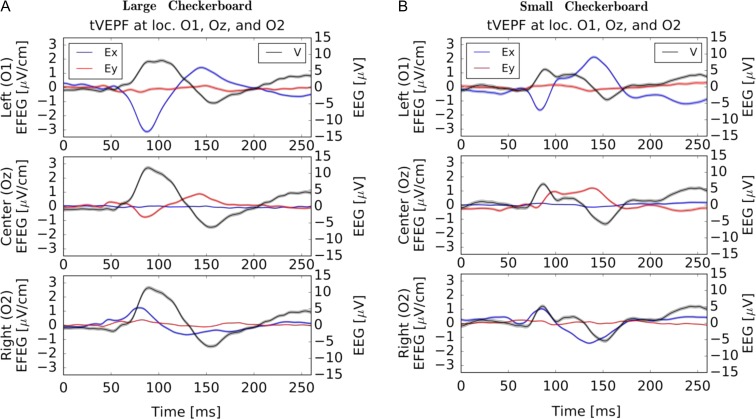
FIGURE 3.
Binocular tVEPF responses (average of 180 trials, 500 ms each) at locations O1, Oz, and O2 for a normal sighted adult with (A) “Large” (90 degrees) and (B) “Small” (30 degrees) reversing checkerboard patterns. The EFEG signal scales are on the left and EEG scales are on the right-hand side of axes. Colored bands show mean error estimates: the thinner bands for EFEG indicate potentially lower noise levels (higher signal-to noise ratio). The EEG shows typical P100 peaks with approximately a factor of 2 amplitude difference, but little change in peak latency. For strong signals, the EFEG peak locations are less ambiguous than EEG. The EFEG data show an interesting pattern for both data sets: Ex signals peak in opposite directions between O1 and O2 and have higher amplitudes here than Ey; at the central position Ey has higher amplitude, but it is weak on the side locations. In contrasting the data sets, the Ey signal is qualitatively different with Oz initial peak polarization reversed and latency increased by 14 ms for the “Small” pattern relative to the “Large” pattern. These differences may arise from the rentinotopic mapping of the peripheral visual field into the cortical layers extending into the interhemispheric cleft.

