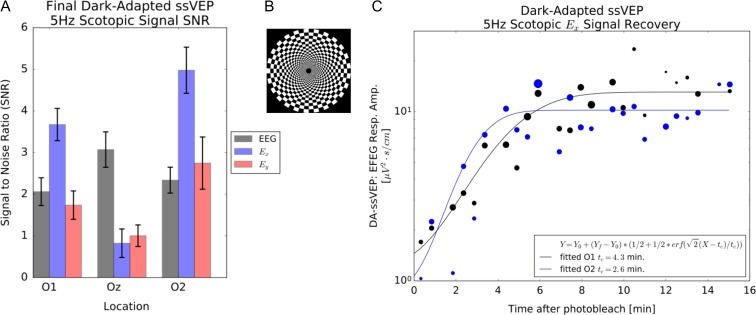
FIGURE 6.
(A) ssVEPF SNR for a 5 Hz scotopic stimulus for a normal subject after dark adaptation. The superior sensitivity of the EFEG mode Ex compared with standard EEG mode is evident. (B) Peripheral log polar checkerboard stimulus pattern. (C) Fitted recovery of the EFEG Ex signal at locations O1 and O2 during dark adaptation following a photobleaching stimulus. Asymmetry between O1 and O2 recovery times may be subject specific.

