Figure 1.
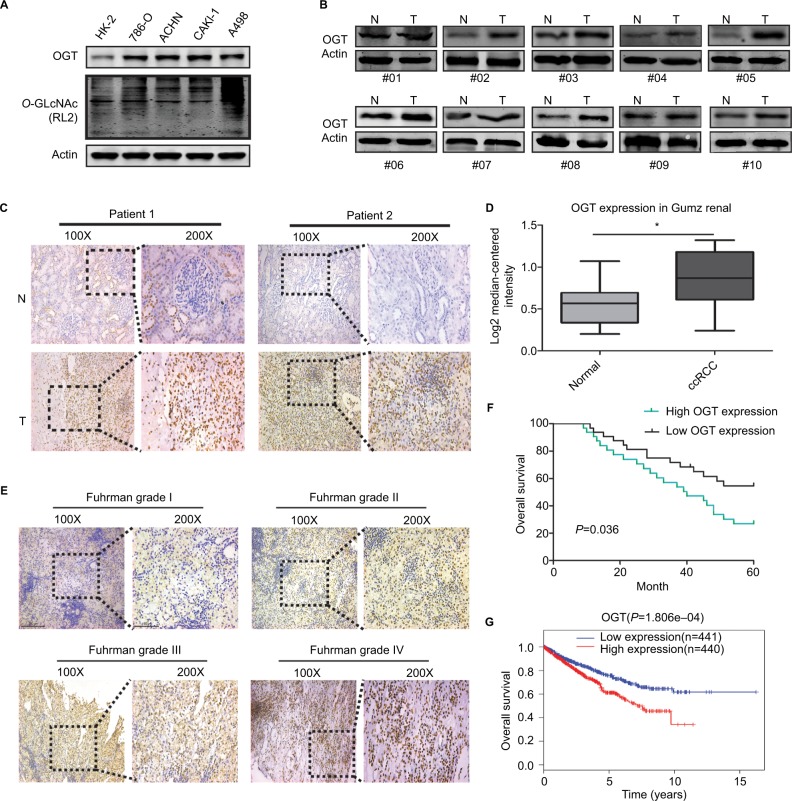
Hyper-O-GlcNAcylation and OGT Overexpression Occur in renal cell carcinoma
Notes: (A) Expression levels of O-GlcNAcylation and OGT in RCC (786-O, ACHN, CAKI-1, and A498) cell lines compared with the human normal renal tubular epithelial HK-2 cell line. (B) Expression levels of OGT in RCC and adjacent normal tissues were detected by Western blot. (C) Representative images of immunohistochemical staining for OGT expression in RCC and adjacent normal tissues. (D) Oncomine expression analysis of OGT in human RCC and normal renal tissues. (E) Comparison of OGT expression in Fuhrman grades I–IV of RCC tissue samples by IHC staining (left panel, magnification ×100; right panel, magnification ×200). (F) Kaplan–Meier analysis of the correlation between OGT expression and overall survival in RCC patients. (G) Overall survival in RCC patients with high or low expression of OGT from TCGA datasets.
Abbreviations: ccRCC, clear cell RCC; O-GlcNAc, O-linked N-acetylglucosamine; OGT, O-GlcNAc-transferase; RCC, renal cell carcinoma; TCGA, The Cancer Genome Atlas.

