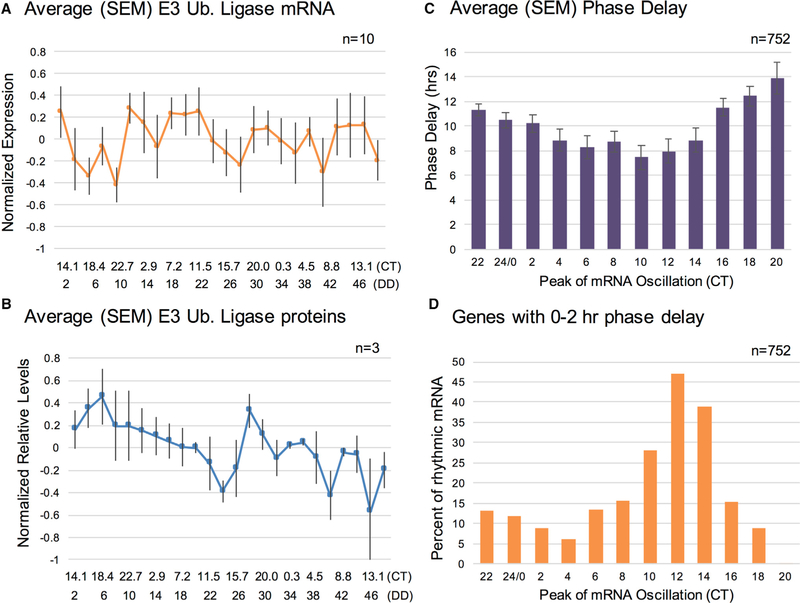
Figure 3. Rhythmic Protein Degradation Is Unlikely to Be the Primary Mechanism Underlying Circadian Post-transcriptional Regulation in Neurospora.
(A) Average (SEM) expression levels of rhythmic E3 ubiquitin ligase transcripts from the RNA-seq data.
(B) Average (SEM) of protein levels of rhythmic E3 ubiquitin ligases from the TMT-MS data.
(C) Average (SEM) phase delays, by time of peak mRNA phase, for genes rhythmic at both levels.
(D) The percent of genes that are rhythmic at both the mRNA and protein levels at a given time point that have a 0–2 hr phase delay, shown by time of day at which the mRNA peaks in its oscillation. Note that percentages are calculated separately for each time point. WT, wild-type; CT, circadian time; SEM, standard error of the mean; TMT-MS, tandem mass tag mass spectrometry.
See also Table S5.

