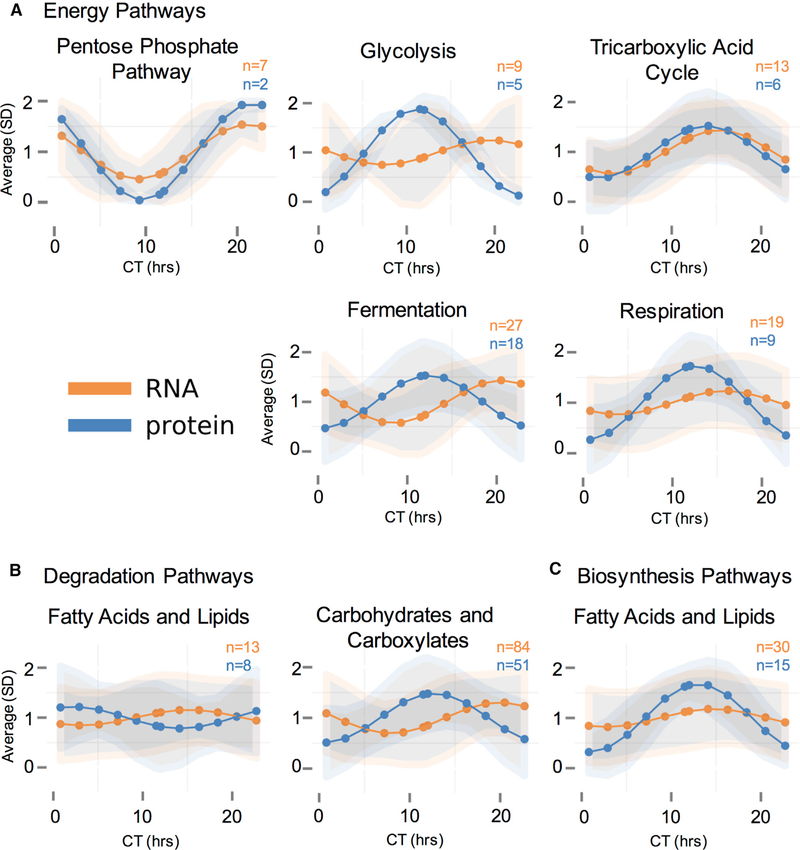
Figure 5. Average Modeled Rhythmic mRNA and Protein Levels within BioCyc Categories Suggest Post-transcriptional Regulation of Metabolic Pathways.
(A–C) A graphic representation of the average of modeled rhythmic mRNA or protein levels in a given BioCyc category over the circadian day (CT). Large dots and lines are the average of all modeled rhythmic levels within a BioCyc category, and shaded areas are the standard deviations around those averages. BioCyc pathways presented are (A) energy pathways, including the pentose phosphate pathway, glycolysis, the tricarboxylic acid cycle, fermentation, and aerobic respiration; (B) degradation pathways, including fatty acid and lipid degradation and carbohydrate and carboxylate degradation; and (C) biosynthesis pathways, including fatty acid and lipid biosynthesis. In all cases, mRNA is orange, and protein is blue; and the number of proteins and mRNAs that fall into each category are displayed on the graph.
See also Figure S6.

