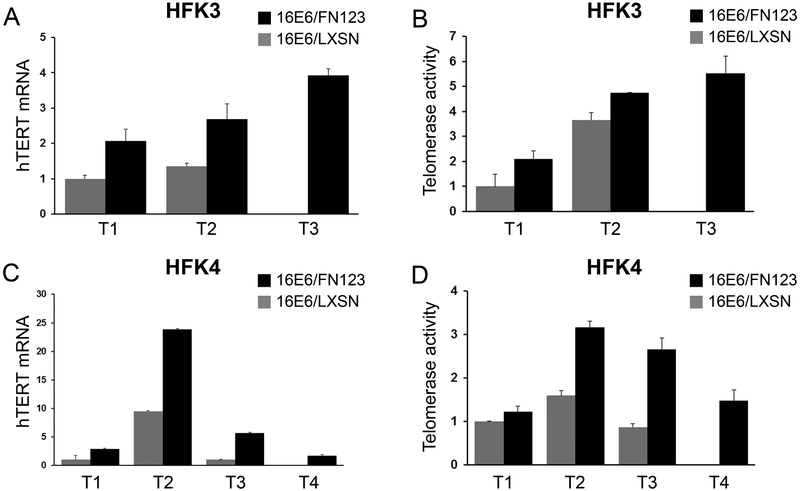
Figure 5. hTERT expression and telomerase activity was increased and rose further over time in 16E6/FN123 HFKs.
Relative levels of hTERT mRNA and telomerase activity were quantified, and values shown were the mean fold change relative to 16E6/LXSN HFKs at T1 (noted as vertical arrows in Figure 2C and D). (A) 16E6/FN123 HFK3 (black bars) had 2 to 4 fold greater hTERT. (B) 16E6/FN123 HFK3 (black bars) had 2 to 6 fold greater telomerase activity. (C) 16E6/FN123 HFK4 (black bars) had 2 to 25 fold greater hTERT. (D) 16E6/FN123 HFK4 (black bars) had 1 1/3 to 3 1/2 fold greater telomerase activity. (A and C: hTERT qPCR was normalized to the mRNA levels of the housekeeping gene 36B4. A-D: error bars represent 95% confidence intervals from the technical replicates shown (n = 3).)

