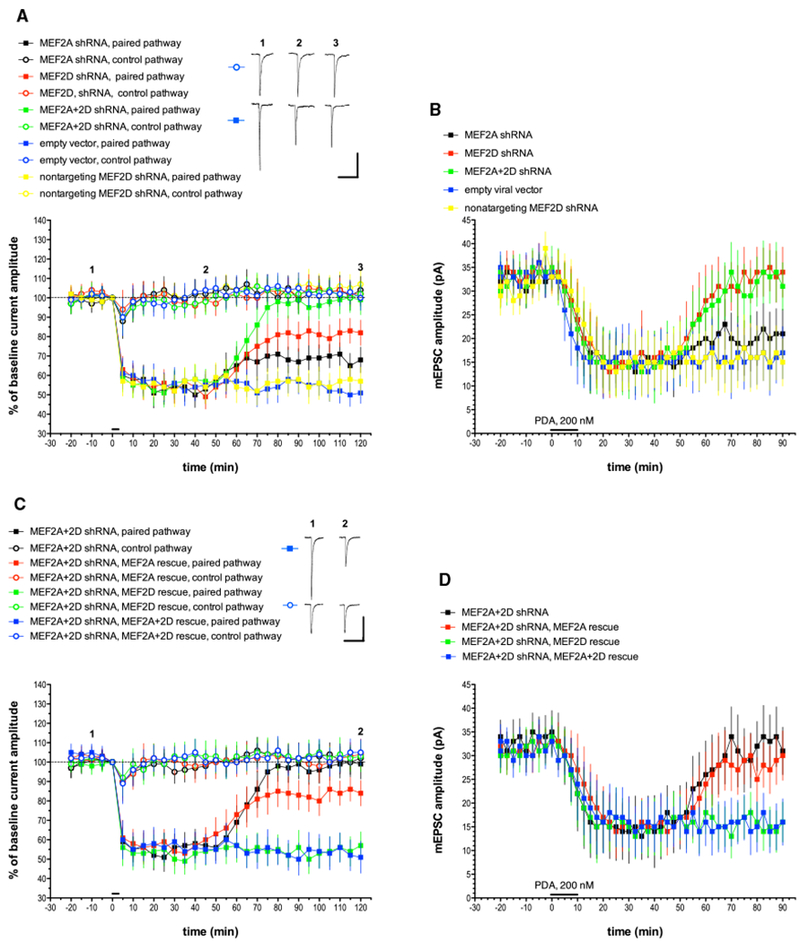
Figure 1. MEF2A and MEF2D Knockdown with shRNA Blocks the Late Phase of Cerebellar LTD, and This Blockade Is Completely Rescued by the Co-expression of shRNA-Resistant MEF2D.

(A) Purkinje cells were transfected with plasmids designed to express various shRNAs, and recordings were made 1–3 days later. Test pulses of glutamate were applied to two non-overlapping sites on the Purkinje cell dendrite. Pulses were alternated at 10 s intervals. To induce LTD, at t = 0 min, six 3-s-long depolarizing commands to 0 mV were coupled with glutamate pulses delivered only to the paired pathway at t = 0 min, as indicated by the horizontal bar. The control pathway received only somatic step depolarization at t = 0 min. Alternate test pulses were then resumed for the duration of the experiment. Exemplar traces are single (unaveraged) responses, and they correspond to the points indicated on the time course graph. Plot points indicate the mean ± SEM in this and all subsequent graphs. MEF2A shRNA, n = 8; MEF2D shRNA, n = 8; MEF2A+2D shRNA, n = 8; empty vector, n = 7; nontargeting MEF2D shRNA, n = 7. Scale bars represent 2 s, 100 pA. When compared with the empty vector paired pathway, the late phase of LTD measured at t = 120 min was significantly different from the paired pathway responses in the MEF2A shRNA group (p < 0.05), the MEF2D shRNA group (p < 0.01), and the MEF2+2D shRNA group (p < 0.001) but not the nontargeting MEF2D shRNA group (p > 0.20). Statistics by Mann-Whitney U test with Bonferroni correction for multiple comparisons in this and all following LTD figures.
(B) Purkinje cells were treated with shRNAs as described above and recordings of mEPSCs were made in the presence of tetrodotoxin (TTX) and picrotoxin. After measuring baseline mEPSCs, a global, chemical form of LTD was produced by a 10-min-long bath application of the synthetic PKC activator phorbol-12,13-diactate (PDA, 200 nM, indicated by the horizontal bar), and mEPSC recording was continued. n = 10 cells/group. When compared with the empty vector pathway, the late phase of chemical LTD measured at t = 90 min was significantly different from the paired pathway responses in the MEF2D shRNA group (p < 0.05) and the MEF2A+2D shRNA group (p < 0.05) but not the nontargeting MEF2D shRNA group (p > 0.20) or the MEF2A shRNA group (p > 0.20).
(C) Exemplar traces are single (unaveraged) responses, and they correspond to the points indicated on the time course graph. MEF2A+2D shRNA, n = 8(these are the same data shown in Figure 1A, re-plotted here to allow for comparison with rescue treatments); empty vector, n = 7; nontargeting MEF2D shRNA, n = 7; MEF2A+2D shRNA, MEF2A rescue, n = 7; MEF2A+2D shRNA, MEF2D rescue, n = 6; MEF2A+2D shRNA, MEF2A+2D rescue, n = 7. Scale bars represent 2 s, 100 pA. When compared with the MEF2A+2D shRNA group with no rescue plasmid, paired pathway late LTD responses were significantly different from the MEF2D rescue group (p < 0.001) and the MEF2A+2D rescue group (p < 0.001) but not the MEF2A rescue group (p > 0.10).
(D) mEPSC recordings and chemical LTD induction by PDA were performed as indicated for Figure 1B. n = 10 cells/group. When compared with the MEF2A+2D shRNA group with no rescue plasmid, late chemical LTD responses were significantly different from the MEF2D rescue group (p < 0.05) and the MEF2A+2D rescue group (p < 0.05) but not the MEF2A rescue group (p > 0.20).
See also Figures S1 and S2 and Table S1.
