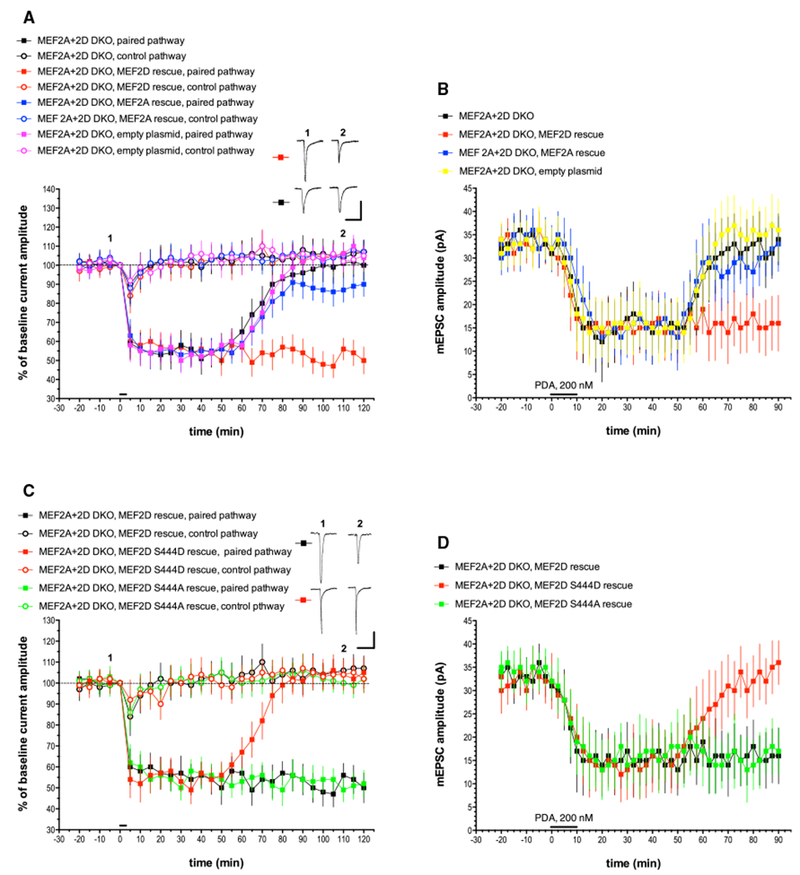
Figure 2. The Late Phase of LTD Is Abolished in Cre-lentivirus-Infected Purkinje Cells Derived from MEF2A+2D Double Conditional Mice and Is Completely Rescued by a WT MEF2D Expression Construct but Not a Phosphomimetic Point Mutant, MEF2D S444D.

(A) Exemplar traces are single (unaveraged) responses, and they correspond to the points indicated on the time course graph. MEF2A+2D DKO, n = 8; MEF2A+2D DKO, MEF2D rescue, n = 7; MEF2A+2D DKO, MEF2A rescue, n = 8; MEF2A+2D DKO, empty plasmid, n = 7. Scale bars represent 2 s, 100 pA. When compared with the MEF2A+2D DKO paired pathway, the late phase of LTD measured at t = 120 min was significantly different from the paired pathway responses in the MEF2D rescue group (p < 0.001) but not the MEF2A rescue group (p > 0.10) or the empty plasmid control group (p > 0.20).
(B) mEPSC recordings and chemical LTD induction by PDA were performed as indicated for Figure 1B. n = 10 cells/group. When compared with the MEF2A+2D DKO paired pathway, the late phase of chemical LTD measured at t = 90 min was significantly different from the responses in the MEF2D rescue group (p < 0.05) but not the MEF2A rescue group (p > 0.20) or the empty plasmid control group (p > 0.20).
(C) Exemplar traces are single (unaveraged) responses, and they correspond to the points indicated on the time course graph. MEF2A+2D DKO, MEF2D rescue, n = 7 (these are the same data shown in Figure 2A, re-plotted here to allow for comparison with the point mutants); MEF2A+2D DKO, MEF2D S444D rescue, n = 6; MEF2A+2D DKO, MEF2D S444A rescue, n = 6. Scale bars represent 2 s, 100 pA. When compared with the MEF2A+2D DKO, MEF2D rescue paired pathway, the late phase of LTD was significantly different from the paired pathway responses in the MEF2D S444D rescue group (p < 0.001) but not the MEF2D S444A rescue group (p > 0.10) or the empty plasmid control group (p > 0.20).
(D) mEPSC recordings and chemical LTD induction by PDA were performed as indicated for Figure 1B. n = 10 cells/group. When compared with the MEF2A+2D DKO, MEF2D rescue group, the late phase of chemical LTD was significantly different from the paired pathway responses in the MEF2D S444D rescue group (p < 0.01) but not the MEF2A S444A rescue group (p > 0.20).
See also Figures S1–S3 and Table S1.
