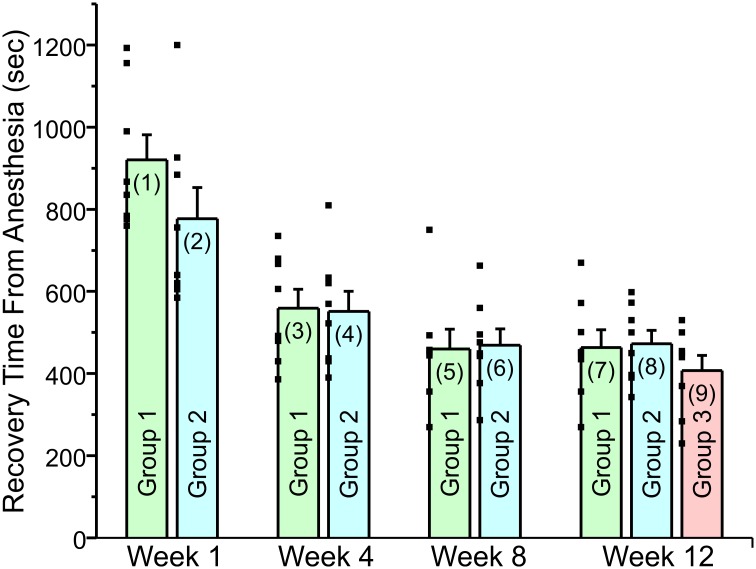
Fig 3. Weekly anesthesia or anesthesia on a 3 or 4 week schedule had similar effect on recovery time from isoflurane anesthesia as long as the rats were handled and transported on a weekly basis.
This was also true for rats that were anesthetized once, at week 12. The figure plots the recovery time from anesthesia for the rats receiving weekly anesthesia, anesthesia on a 3–4 week schedule or receiving anesthesia once at week 12. The individual recovery times are plotted as small filled squares to the left side of each bar. All three groups were handled and transported every week. The figure shows the same time course for acceleration of recovery from anesthesia, without regard to whether the animals were anesthetized or not. Weekly anesthesia rats (Group 1) received isoflurane anesthesia once per week until week 12. Rats anesthetized on either a 3 or 4 week schedule, (Group 2) received isoflurane anesthesia at week 1, 4, 8 and 12. The rats in Group 3 were transported and handled in an identical manner to weekly rats and were anesthetized once at the very end of the study (week 12 Each data bar is labeled with a number in parenthesis. Recovery time, in seconds, for Group 1 on Week 1 is shown in Bar (1): Mean = 920 ± 61.2 (SEM). Bar (2): Mean = 777 ± 75.9. Bar (3): Mean = 559.5 ± 45.7. Bar (4): Mean = 551.6 ± 48.8. Bar (5): Mean = 459.5 ± 48.6. Bar (6): Mean = 468.8 ± 39.9. Bar (7): Mean = 463.3 ± 43.5. Bar (8): Mean = 472.6 ± 32.6. Bar (9): Mean = 407.4 ± 37. A paired T-test was used to compare data within groups while an independent T-test was used to compare data between groups. All comparisons can be found in Table 1. (1) vs (2) compares the significance of the difference between the data plotted in bar (1) vs bar (2). (1) vs (3) compares the significance of the difference between the data plotted in bar (1) and bar (3) etc. There are discrepancies in P value for Group 1 in Fig 2 and Fig 3 because repeated measure ANOVA and paired T-test were used respectively.

