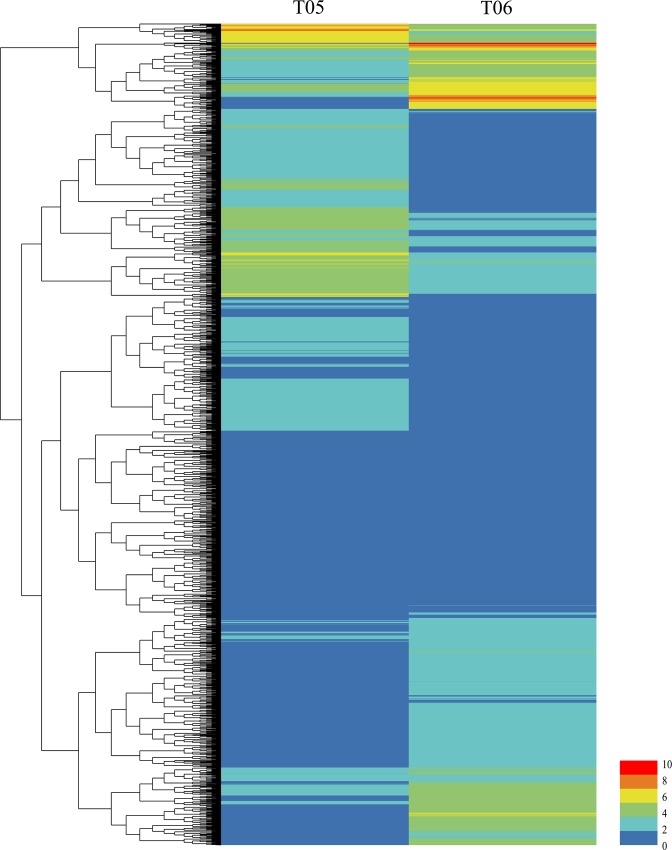
Fig 1. Hierarchical clustering analysis of DEGs between T05 and T06.
T05, 5 DAP; T06, 14 DAP. A total of 9,358 genes were identified at two developmental stages. The color key represents the FPKM (Fragments Per Kilobase of exon per Million fragments mapped) normalized log2 transformed counts. Red and blue represent high and low expression. Each row represents a gene.

