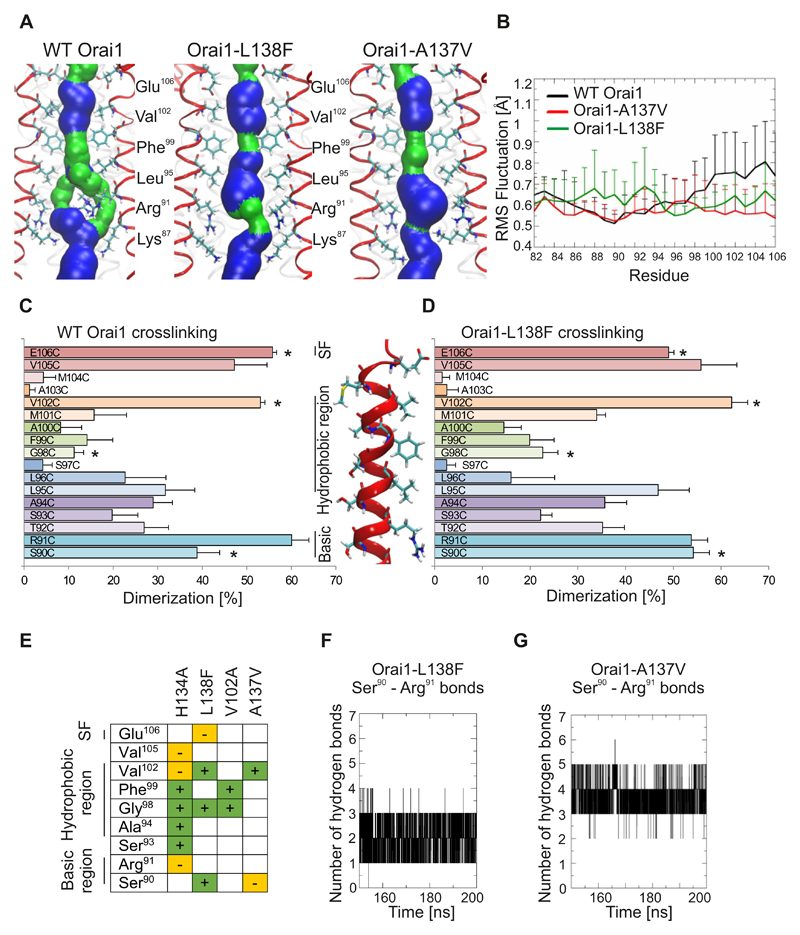
Figure 8. Pore rearrangements in Orai1 mutants related to myopathy and identified by cancer database screening.
(A) Representative snap shots of the equilibrated part of 200-ns-long molecular dynamics simulations for wild-type Orai1, Orai1-R91G and Orai1-H134A showing the pore forming TM1 helices (4 out of 6 TM1 helices shown in red) and pore lining residues from Glu106 to Lys87. The pore surface is shown in blue (radius > 1.15Å) and green (radius: 0.6 to 1.15Å). (B) Differences among individual TM1 residues for wild-type Orai1, Orai1-A137V and Orai1-L138F are measured as root mean square (RMS) deviation of Cα atom for the last 50 ns of 200-ns-long molecular dynamics simulations. (C,D) Dimerization efficiency (%) of cysteine crosslinking for engineered cysteines (S90C to E106C) in the wild-type Orai1 (C) and Orai1-L138F (D) TM1 pore segment. For each cysteine position, wild-type Orai1 and Orai1-L138F mutations were performed on the same day (n = 5 – 8 transfections for each cysteine position), and significant differences (t-test, p < 0.05) are indicated by a star (*). (E) The crosslinking results Orai1-H134A, Orai1-L138F, Orai1-V102A and Orai1-A137V as compared to wild-type Orai1. + and green, significantly-increased crosslinking. – and orange, significantly-decreased crosslinking. (F,G) The time course depicts the number of hydrogen bonds formed between residues Arg91 and Ser90 for last 50 ns of the Orai1-L138F (F) and Orai1-A137V (G) simulations.

