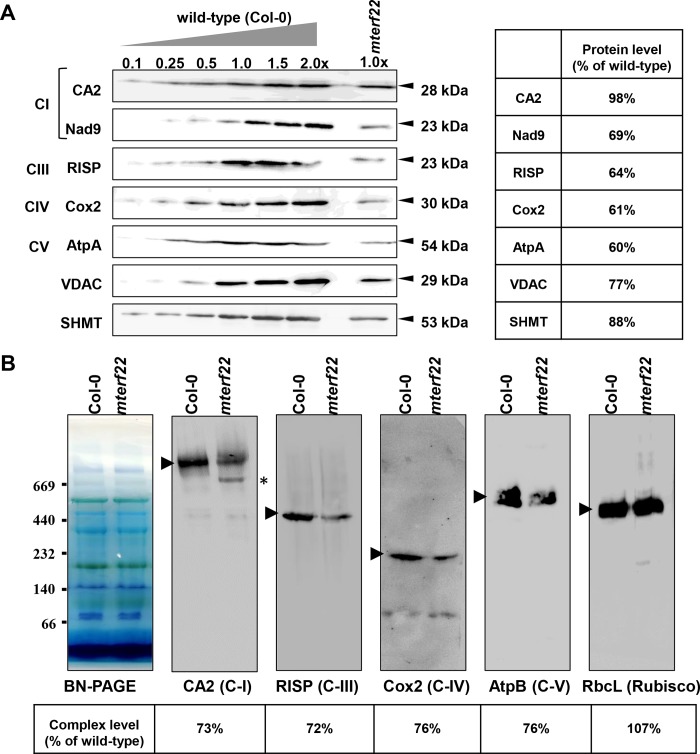
Fig 7. Relative accumulation of organellar proteins in wild-type and mterf22 plants.
(A) Immunoblot analyses of wild-type plants and mterf22-1 mutant line. For the quantification of the relative abundances of organellar proteins in mterf22 plants, different amounts of total mitochondrial proteins extracted from wild-type plants were loaded and separated by SDS-PAGE. The blots were probed with polyclonal antibodies raised to different organellar proteins, as indicated in each panel. Detection was carried out by chemiluminescence assays after incubation with HRP-conjugated secondary antibody. (B) BN-PAGE of crude mitochondria preparations was performed according to the method described in [57]. Crude mitochondria preparations, obtained from 3-week-old Arabidopsis seedlings, were solubilized with DDM [1.5% (w/v)] and the organellar complexes were resolved by BN-PAGE. For immunodetection, proteins were transferred from the native gels onto a PVDF membrane and were probed with specific antibodies (S2 Table), as indicated below each blot. Arrows indicate to the native complexes I (~1,000 kDa), III (dimer, ~500 kDa), IV (~220 kDa) and V (~600 kDa). The asterisk in the CA2 panel indicates to the presence of a 700 ~ 800 kDa band, which may correspond to a complex I assembly intermediate. Hybridization signals were analyzed by chemiluminescence assays after incubation with HRP-conjugated secondary antibody. The intensities of protein signals in panels ‘A’ and ‘B’ using ImageJ software [90].

