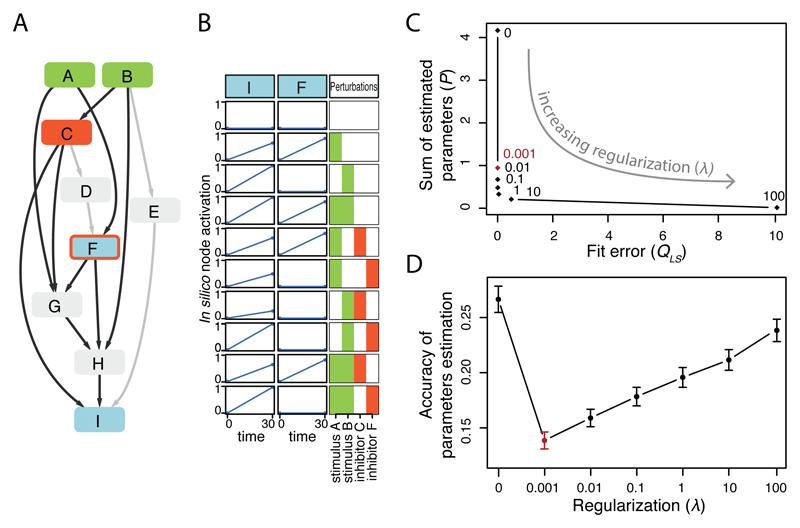
Fig. 3.
In silico example to illustrate modeling approach. A. In silico general network (PKN) with edges used for data simulation highlighted in black. B. One (out of 10) example of simulated perturbation data used to illustrate L1 regularization. C. Goodness of fit (QLS, i.e. sum of squared residuals) versus model sparsity (P, i.e. sum of estimated parameters) for different values of tunable regularization term λ, (λ=0, 0.001, 0.01, 0.1, 10, 100) resulting in an L-shaped curve (each dot is the mean value obtained from the 10 in silico datasets). D. Mean accuracy (error bars represent standard deviation) of the estimated parameters (sum of the square of the difference between estimated and true parameters) as function of λ. Optimal λ is depicted in red.

