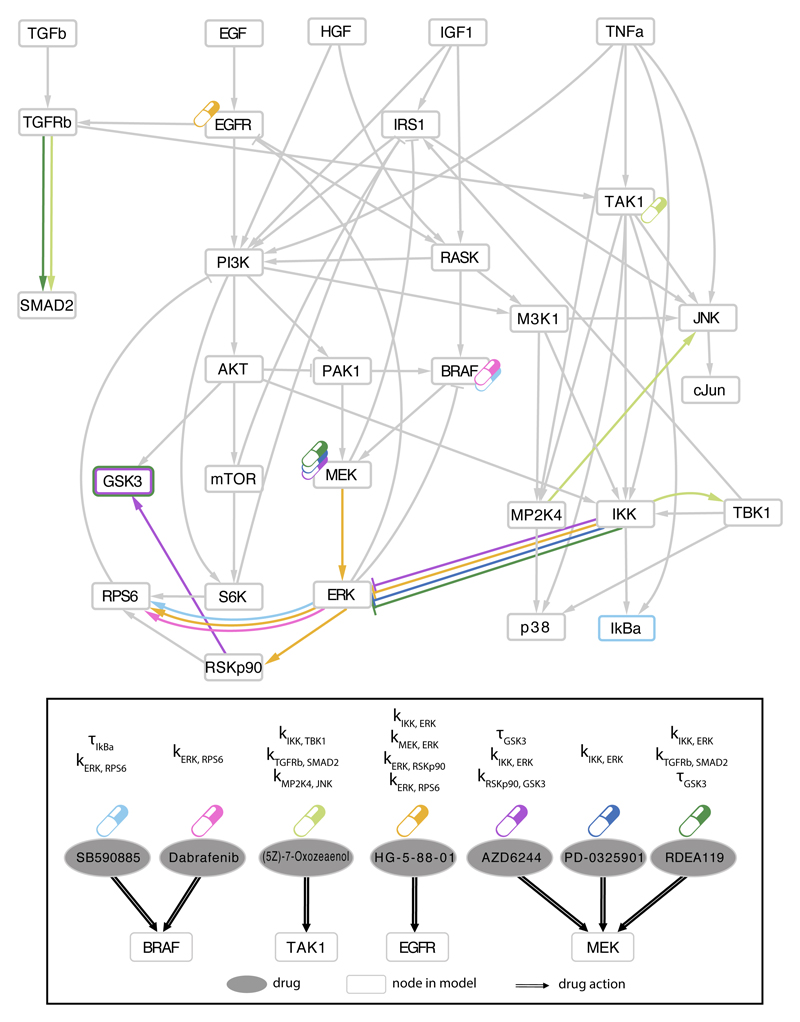
Fig. 5.
Associations between model parameters and drug sensitivity. Among the top 25 parameter-drug associations resulting from Elastic Net selection, those involving drugs with no genetic biomarkers are schematically mapped to the signaling pathways. Drug targets for the 7 drugs listed as ellipses in the bottom panel, are shown in the compressed PKN (upper panel) using the corresponding colored drug symbols. Corresponding model parameter associations for each drug are shown in the PKN using the same color code to mark edges corresponding to parameters kj,i (strength of edge from j to i) and nodes border for corresponding responsiveness parameters τi (node i).

