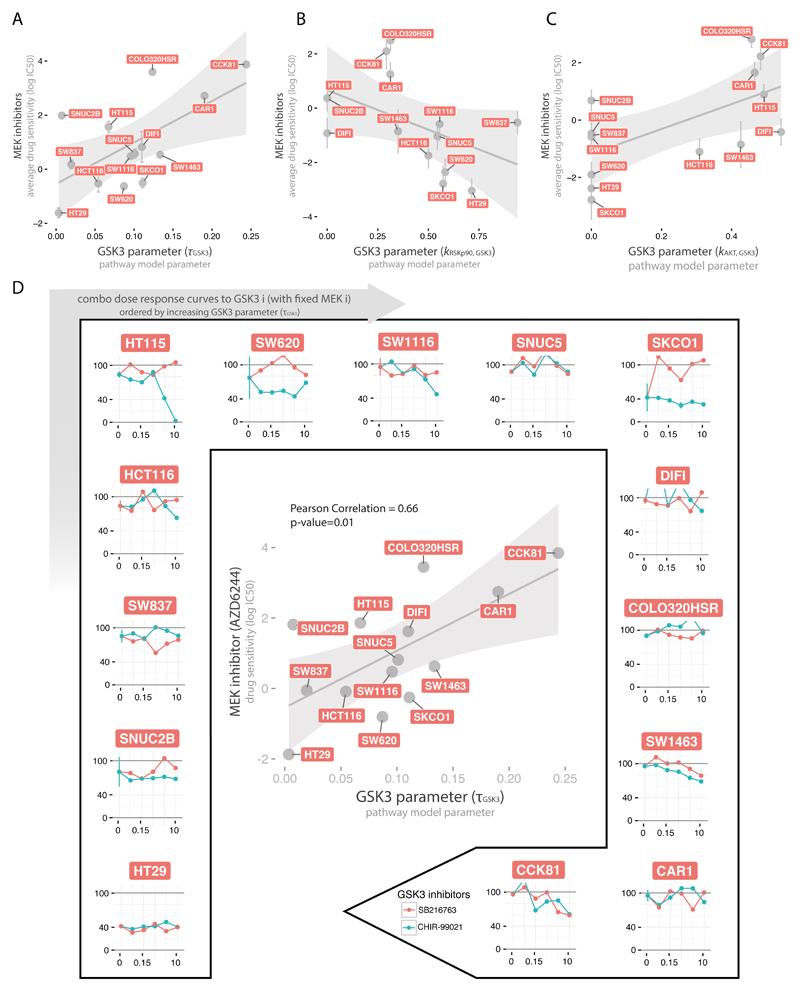
Fig. 6.
Association between MEK inhibitors and GSK3 model parameters. A-C. Scatterplots of the three GSK3 related model parameter (τGSK3, kRSKp90,GSK3, kAKT,GSK3 in panel A, B and C respectively) versus the mean sensitivity of the respective associated MEK inhibitors (at least two for each parameter), with error bars representing the standard error. D. In the center, scatterplot of the strongest association between MEK inhibitor (AZD6244) and GSK3 node parameter (τGSK3). In the external plots, dose-response curves when combining MEK inhibitor (Trametinib) (at fixed concentration 0.005 μM) with two GSK3 inhibitors (SB216763 and CHIR-99021) at increasing concentrations (0, 0.039, 0.156, 0.625, 2.5, 10 μM). Plots for the 14 CRC cell lines are ordered clockwise according to their τGSK3 parameter value.

