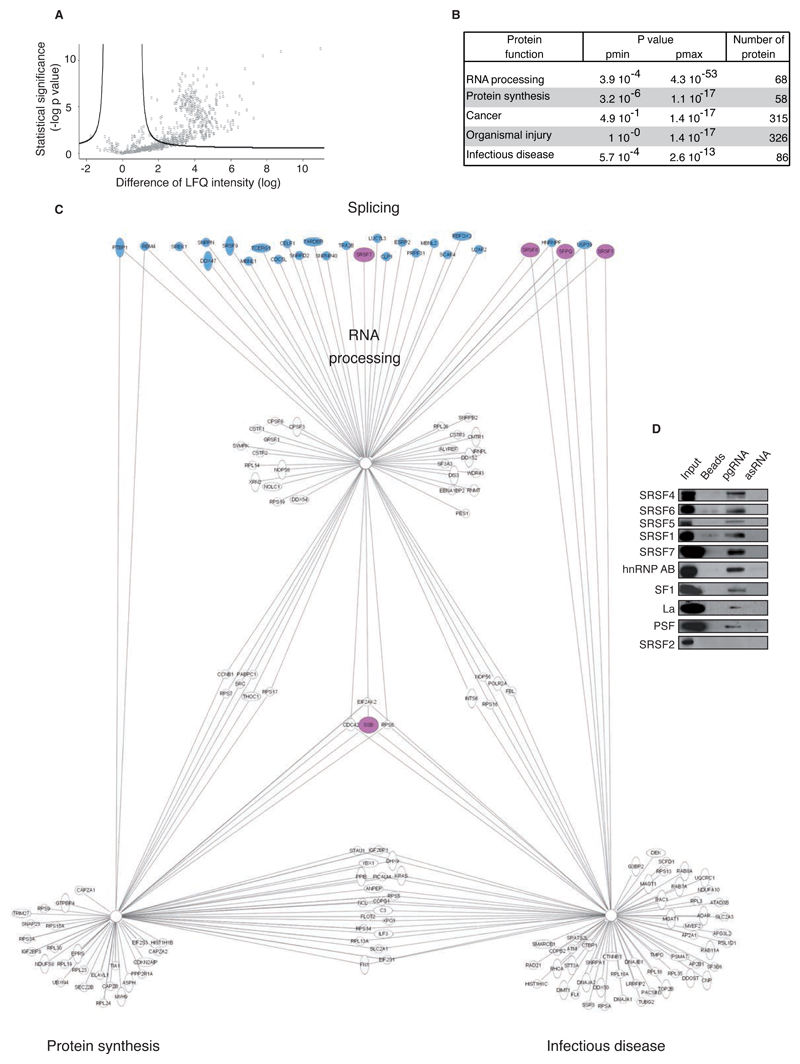
Fig. 2. Identification of cellular splicing factors interacting with HBV pgRNA.
(A) Volcano plot representation of HBV pgRNA-interacting proteins (700/1442) detected in 6 independent RNA pull-down assays (beads used as control) and identified by mass spectrometry (nanoRSLC-LTQ Orbitrap Velos). Proteins showing a significant interaction with HBV pgRNA (n=389/700) are depicted uppers the black line according to significance analysis. X-axis shows the difference of the average of the logarithm of Label Free Quantification (LQF) intensities between pgRNA and control; y-axis shows the negative logarithmic of t-test Welsh p-value. (B) Biological function groups of HBV pgRNA binding proteins identified. (C) Schematic network presenting the main protein families binding to HBV pgRNA according to Ingenuity software. Transregulatory splicing factors are colored in blue and the ones selected for further characterization are colored in pink. (D) HBV pgRNA pull-down extract analysis by western blot confirming a specific interaction of 9 selected trans-regulatory splicing factors with pgRNA (antisense pgRNA (asRNA), beads and SRSF2 protein were used as negative control).

