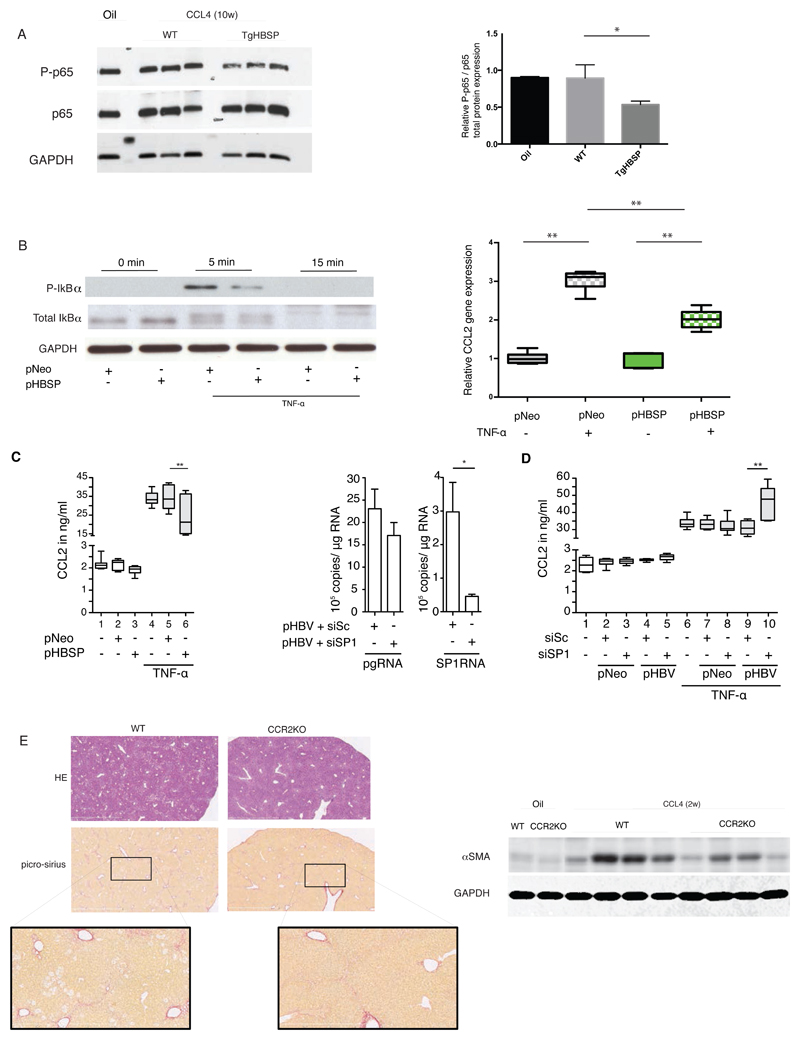
Fig.7. Association between SP1RNA, HBSP and CCL2 expression in vitro.
(A, left panel) Western blot detection of p65 (RelA) total and its phosphorylated form (P-p65) on Ser536 in liver of TgHBSP and control mice treated by vehicle or CCl4 during 10 weeks. (A, right panel) Quantification of P-p65 related expression in liver of TgHBSP and control mice treated by vehicle (n=4), by CCl4 during 10 weeks in control (n=3) and TgHBSP (n=3) mice. (B, left panel) Total IκBα and phosphorylation level in HeLa cells transfected with pNeo or pHBSP plasmids and treated with TNF-α (25ng/ml) for 0, 5, 15 minutes. (B, right panel) Relative CCL2 mRNA quantification (normalized with GAPDH) by RTqPCR measured in HeLa expressing HBSP or control (pNeo) cells and treated or not with TNF-α (25ng/ml) during 30 minutes (n=5 experiments). (C, left panel) Secreted CCL2 protein quantification by HepaRG cells (stimulated or not with 50 ng/ml TNF-α) expressing pNeo (control) or pHBSP plasmid (n=7 experiments). (C, middle panel) HBV pgRNA and SP1RNA quantification from HepaRG cells co-transfected with pHBV plasmid and scramble (siSc) or SP1-siRNA (siSP1) (n=7 experiments). (D) Secreted CCL2 protein quantification by HepaRG cells (stimulated or not with TNF-α) expressing pNeo or pHBV plasmid with siSc or siSP1-siRNAs (n=6 experiments). (E, upper left panel) Representative H&E and Picro-Sirius red stained histological liver section (bar 2mm) and (E lower left panel) focus of Picro-Sirius red stained (bar 800µm) of WT and CCR2Ko mice treated for 2 weeks with CCl4-WT (n=) and CCl4. (E right panel) Fibrosis-related α-SMA protein expression in the liver of WT and CCR2KO mice treated for 2 weeks with oil (n=2) or CCl4 (WT with n=4 out of 5 and CCR2KO with n= 4 out of 5). Mann-Withney U-tests: *p<0.05 and **p<0.01.

