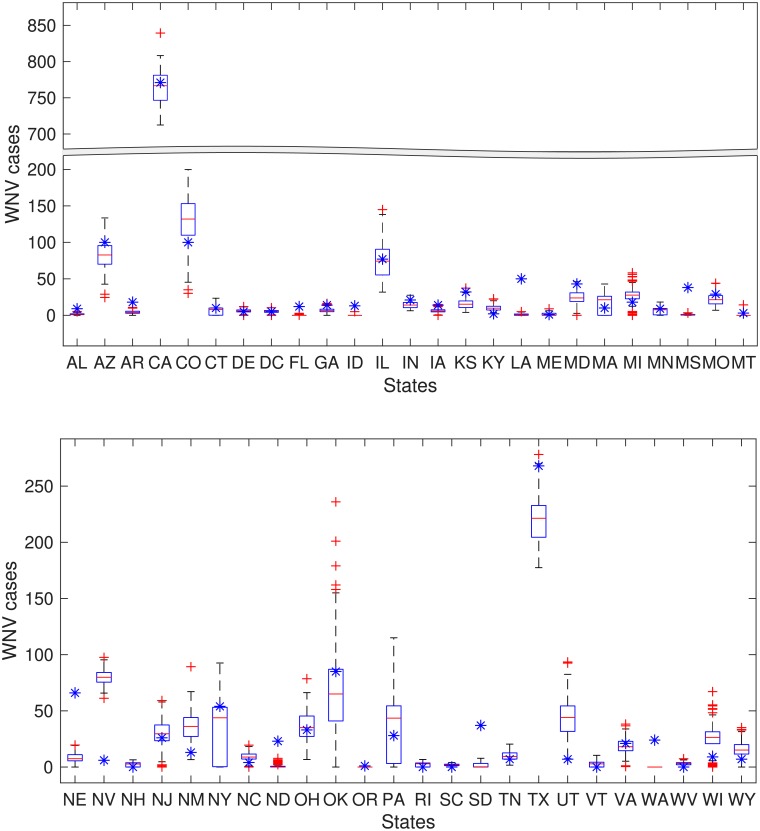
Fig 6. WNV human incidence by states for the year 2015 from power-law influenced by flyway kernel model (for Kpl = 2.3147, β0 = 0.0059day-1, λ = 0.0721day-1, η = 0.4558day-1), generated from 1000 simulation and observed data are indicated by blue colored star points.
States name are given in the short form. Simulated results are represented with a box plot in which the red horizontal lines show the median and the bottom and top edges of the boxes indicate 25th and 75th percentile respectively, The whiskers show the ranges of data points not considered outliers and outliers are showing by red + symbol. Broken scale is used for sake of visualization.

