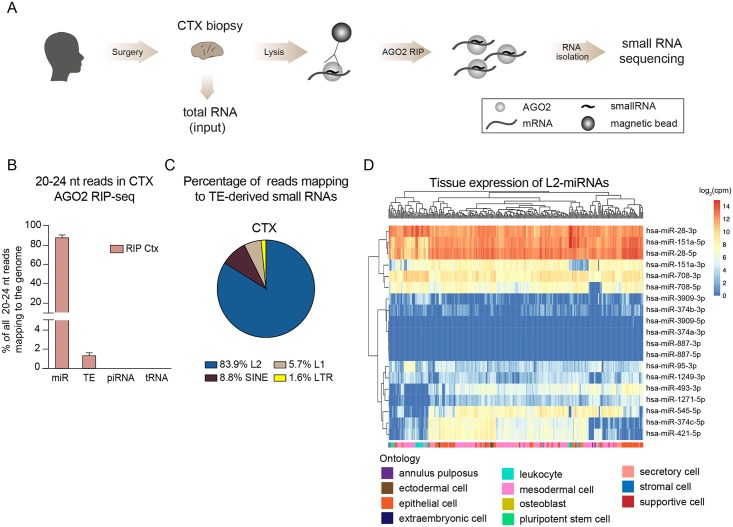
Fig 1. AGO2-associated small RNAs in human cortex tissue.
A) Schematics of AGO2 RIP-seq on human cortex samples followed by small RNA sequencing. B) Bar graph showing the percentage of reads of 20–24 nucleotides (nt) in the human genome mapping to mature miRNAs (miR), transposable elements (TE), piwi RNAs (piRNA), and transfer RNAs (tRNA). Data are represented as mean ± SEM (RIP Ctx n = 3). C) Pie chart showing the percentage of reads mapping to TEs. D) Heatmap depicting the expression of L2-miRNAs (log2(cpm)) across different human tissues and cell types (n = 400). AGO2—Argonaute2, AGO2 RIP—AGO2 RNA immunoprecipitation, CTX—cortex, L1—LINE-1, L2—LINE-2, LTR—long terminal repeat, mir—precursor miRNA, SINE—short interspersed nuclear element.

