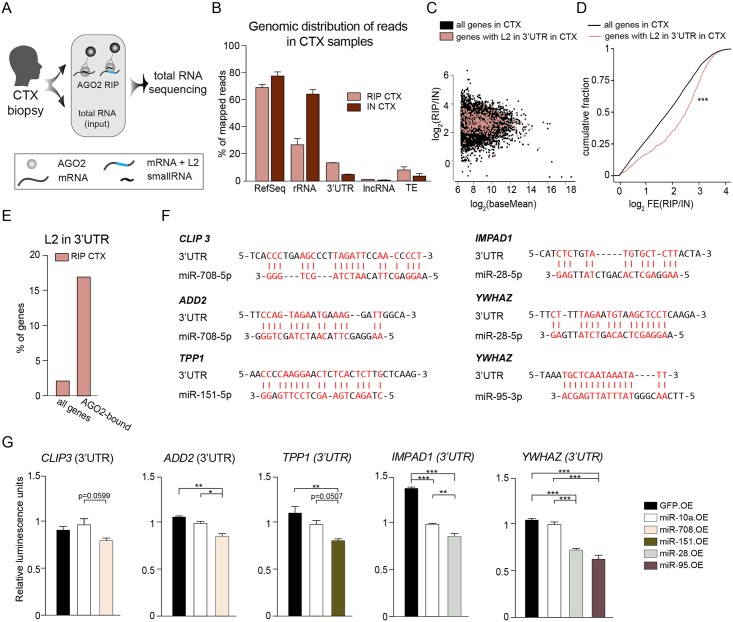
Fig 5. Genes with L2 in 3’UTR are bound by AGO2 in the human brain.
A) Schematics of AGO2 RIP followed by total RNA sequencing on cortex (CTX) biopsies. B) Genomic distribution of RNAs in the AGO2 RIP-seq and input samples of cortex (CTX, n = 2). C) Dot plot of all genes in cortex samples from the human brain. Genes with L2 in the 3’UTR are marked in red. The log2-transformed mean expression (x-axis) is plotted against the log2-transformed fold change of RIP (n = 2) versus input samples (n = 2) (y-axis). D) Cumulative fraction plot of the fold changes of all genes and genes with L2 in their 3’UTR in RIP versus INPUT samples. ***p<0.001 Kolmogorov–Smirnov test. E) Bar plot showing the percentage of genes within the 3’UTR of all genes, and of the top 100 highest-expressed genes that are more than 4-fold enriched in RIP compared to input samples. F) Potential target sites of L2-miRNAs in the L2 sequence in 3’UTRs of genes. Complementary bases are marked in red and with a vertical line. G) Luciferase assay of L2-derived target sites. Data are shown as mean ± SEM. *p<0.05, **p<0.01, ***p<0.001, one-way ANOVA followed by a Tukey’s multiple comparison post-hoc test. AGO2—Argonaute2, AGO2 RIP—AGO2 RNA immunoprecipitation, CTX—cortex, L2—LINE-2, lncRNA—long non-coding RNA, OE—overexpressor, TE—transposable elements, rRNA—ribosomal RNA.

