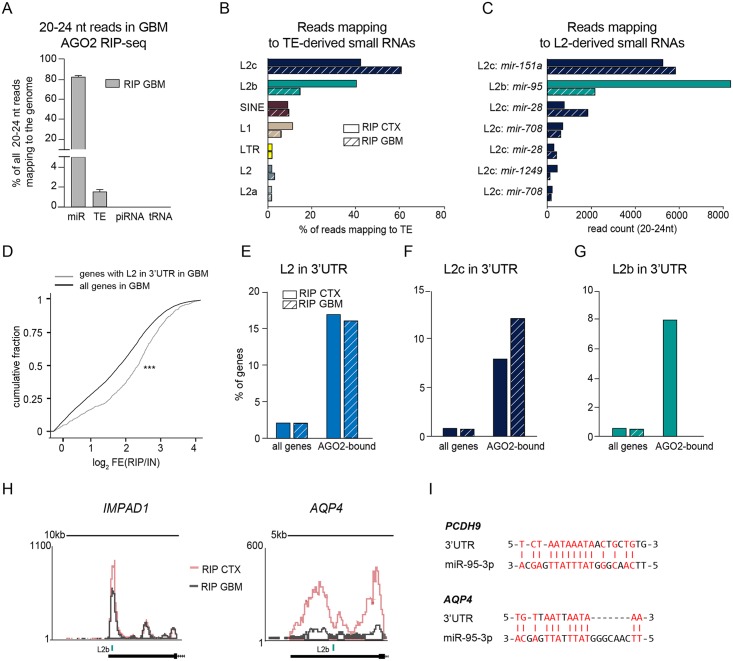
Fig 6. AGO2-associated L2-miRNAs and L2-carrying genes are altered in glioblastoma.
A) Bar graph showing the percentage of 20–24 nt long read mapping to mature miRNAs (miR), transposable elements (TE), piwi RNAs (piRNAs) and transfer RNAs (tRNA). Data are represented as mean ± SEM (RIP GBM n = 6). B) Bar graph showing the percentage of uniquely aligned reads of 20–24 nt mapping to transposons in AGO2 RIP samples of cortex (CTX) and glioblastoma (GBM) tissue (RIP CTX n = 3; RIP GBM n = 6). C) Number of uniquely aligned reads mapping to L2 elements giving rise to precursor miRNAs (mir) in AGO2 RIP-seq samples from cortex and glioblastoma tissue (RIP CTX n = 3; RIP GBM n = 6). D) Cumulative fraction plot of fold changes of all genes and genes with L2 in their 3’UTR in RIP versus INPUT samples. ***p<0.001 Kolmogorov–Smirnov test. E-G) Bar plots showing the percentage of genes with L2 / L2b / L2c in the 3’UTR of all genes, and of the top 100 highest-expressed genes that are more than 4-fold enriched in RIP compared to input samples from cortex and glioblastoma tissue. H) Overlap of UCSC genome browser tracks showing examples of L2-carrying transcripts with altered AGO2 binding in glioblastoma compared to cortex. I) Potential L2b-derived target sites in PCDH9 and AQP4. AGO2—Argonaute2, AGO2 RIP—AGO2 RNA immunoprecipitation, L1—LINE1, L2—LINE-2, LTR—long terminal repeat, SINE—short interspersed nuclear element.

