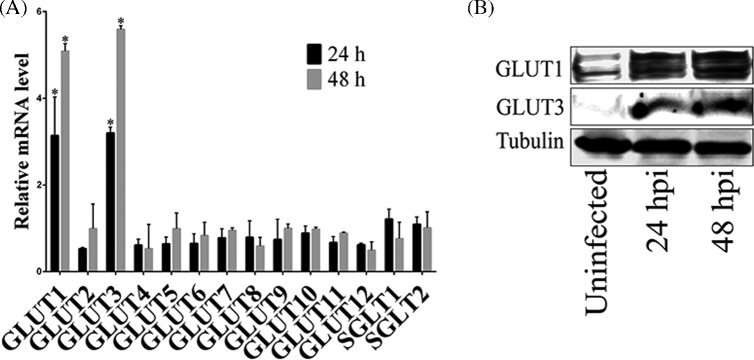
Figure 1.
The expression of GLUT1 and GLUT3 is up-regulated during C. trachomatis infection. (A) Hela cell monolayers were grown in 24-well plates and infected with C. trachomatis for 24 or 48 h prior to testing. Gene expression of different GLUT genes was measured by real-time RT-PCR and normalized to glyceraldehyde 3-phosphate dehydrogenase (GAPDH) expression. The data are presented as relative mRNA levels compared to uninfected cells and shown as the mean ± SD. Each experiment was performed in triplicate and repeated at least three times. Asterisks indicate significantly different values compared with uninfected cells (P < 0.05, Student's t-test). (B) Hela cells grown in 100 mm culture dish were infected with C. trachomatis for 24 and 48 h, respectively. The protein levels of GLUT1 and GLUT3 were evaluated by immunoblotting. The experiment was repeated at least three times with similar results.

