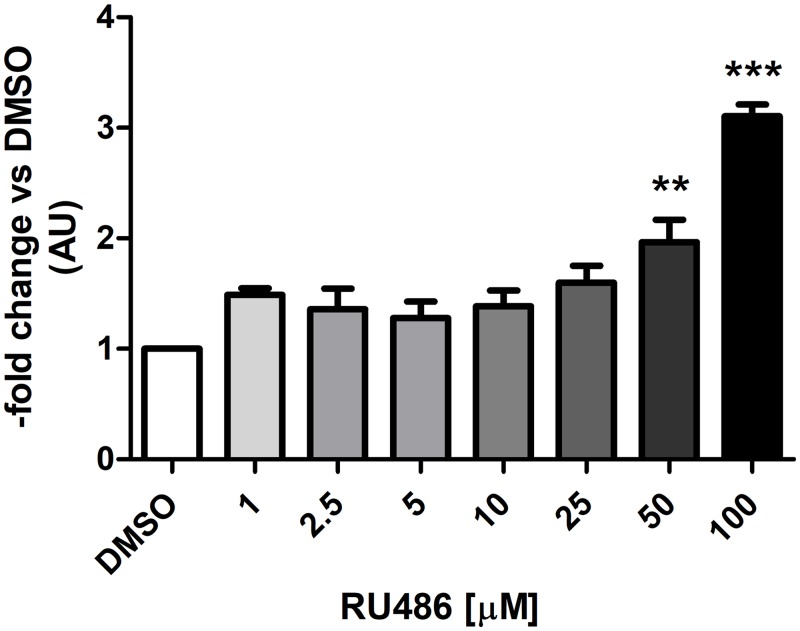
Fig 7. Induction of CYP3A28 mRNA in BFH12 cells exposed to increasing concentrations of RU486 for 6 hours.
BFH12 cells were treated with different concentrations of RU486 (1, 2.5, 5, 10, 25, 50 and 100 μM) for 6 hours, as described in Materials and Methods. The expression of CYP3A28 was detected by qPCR in control (0.1% DMSO) and treated cells, using RPLP0 as internal control gene. The relative expression of DMSO-treated cells was set to 1 and its value was used for the normalization of the other groups. Data are expressed as the mean ± SD of three independent experiments (arbitrary units, AU). Statistical analysis: ANOVA + Tukey’s post test. Significance was defined as: P < 0.01: **, DMSO vs. 50 μM RU486; P < 0.001: ***, DMSO vs. 100 μM RU486.

